

The Bitcoin price forecast long-term valuation model, the Rainbow Chart, suggests that the cryptocurrency remains below its historical trend valuation as October begins. The outlook comes as Bitcoin failed to reclaim the $90,000 level, a move that could have opened the door to a push toward six-figure valuations.
At press time, Bitcoin was trading at $84,584, while remaining above its 50-day SMA of $78,136 and 200-day SMA of $71,404, indicating the broader uptrend remains intact.
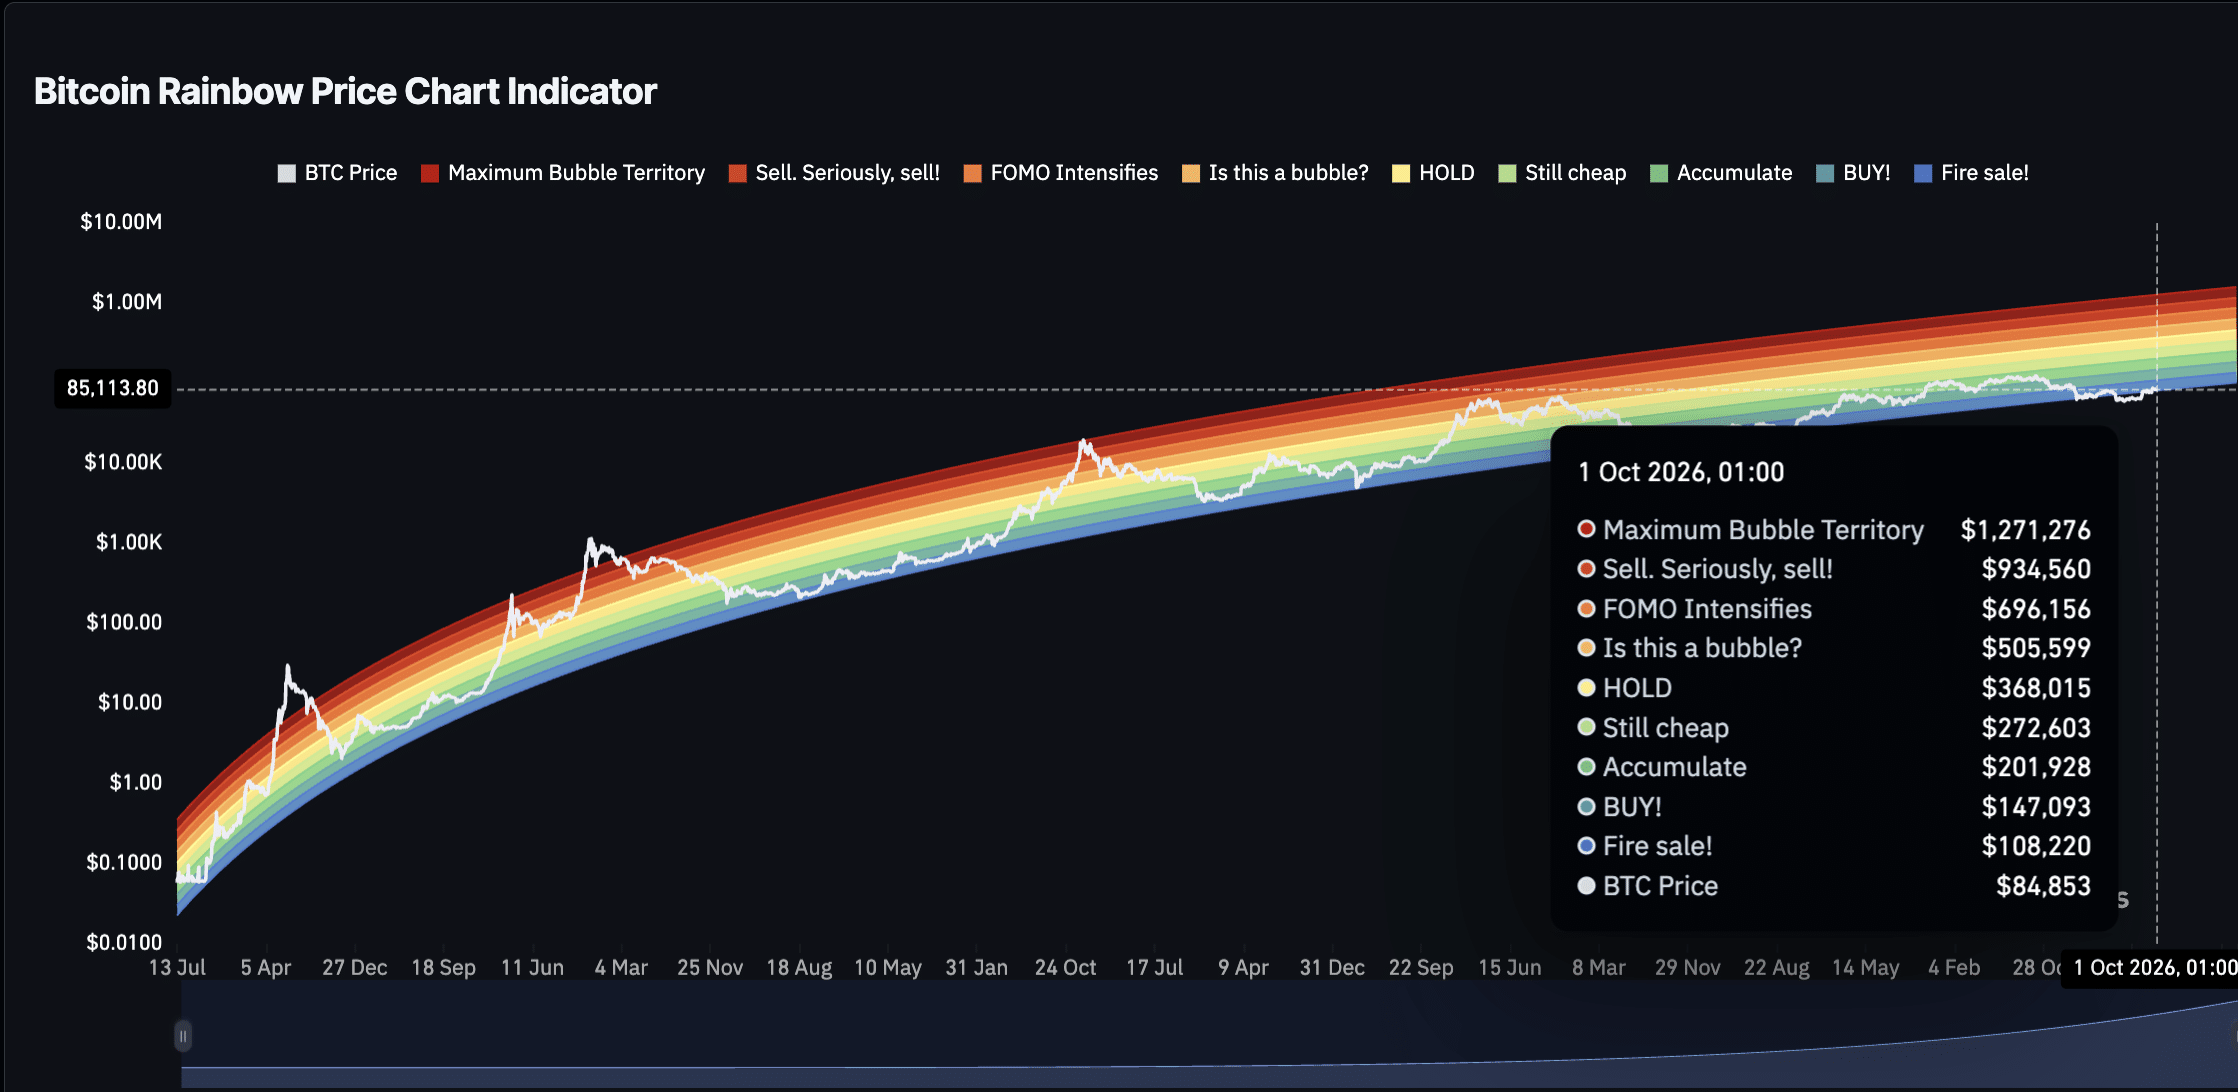
Although the Rainbow Chart’s October 31 valuation bands sit well above Bitcoin’s current price, the indicator is designed to gauge long-term valuation rather than forecast where $BTC will trade by month-end.
According to the chart, the highest valuation zone on October 31 is ‘Maximum Bubble Territory’ at $1.36M, a band historically associated with extreme market euphoria and cycle tops, a position we aren’t yet in.
What Does the Rainbow Chart Say About Bitcoin for October and Beyond?
Below, the ‘Sell. Seriously, SELL!’ zone is marked at $998,844, which corresponds to historically high valuations and increased profit-taking. The ‘FOMO Intensifies’ band is set at $733,467, indicating periods when speculative demand tends to rise.
Next is the ‘Is this a bubble?’ level at $547,041, followed by the ‘HODL!’ zone at $396,987, which is generally regarded as fair value. The ‘Still cheap’ band is positioned at $287,747, while ‘Accumulate’ is at $209,292, both suggesting undervaluation relative to Bitcoin’s long-term trend.
The ‘BUY!’ band is established at $153,802, representing significant undervaluation. The lowest band, ‘Basically a Fire Sale,’ is found at $115,355, a zone historically linked to deep discounts and extreme market pessimism.
Currently, Bitcoin is trading around $85,000, below the chart’s lowest valuation band. This highlights the discrepancy between current market prices and the model’s long-term trajectory.
Bitcoin Short-Term Price Forecast
While the Rainbow Chart mostly focuses on long-term valuation, Bitcoin’s recent rally toward $87,000 stalled in the short term after whales reportedly took profits on more than 30,000 BTC. The $87,000 region also coincided with the upper boundary of a trading channel that has capped prices for more than two weeks.
Not only were whales taking profits on the way up, selling more than 30,000 BTC, but $87,000 also marked the top of the channel that has rejected Bitcoin on multiple occasions.
After the rejection, $82,500 is the immediate downside target. The argument is that if Bitcoin falls to that level and whale accumulation resumes, it could confirm another rebound attempt toward $87,000.
It is highly unlikely that the Rainbow Chart’s Bitcoin Price Forecast of $1.36M by October 31 will come to fruition; however, that chart is merely a tool to show what prices could look like under different market structures.
Bitcoin Hyper (HYPER): Scaling the King of Crypto via Solana’s Virtual Machine

Bitcoin Hyper (HYPER) is an upcoming Layer 2 blockchain on the Solana Virtual Machine (SVM) that settles directly to the Bitcoin mainnet.
Through a non-custodial canonical bridge, users can lock their BTC and mint wrapped Bitcoin on the L2, enabling near-instant finality for DeFi, NFTs, and other decentralized applications. The SVM periodically anchors transaction batches to the Bitcoin blockchain for security.
The native HYPER token is used for network gas fees, staking, governance, and premium features, with a total supply capped at 21 billion tokens. Allocations include 30% for development, 25% for treasury, and 20% for marketing.
The mainnet launch is set for Q4 2026 and will include the canonical bridge, ecosystem dApps, and exchange listings.


