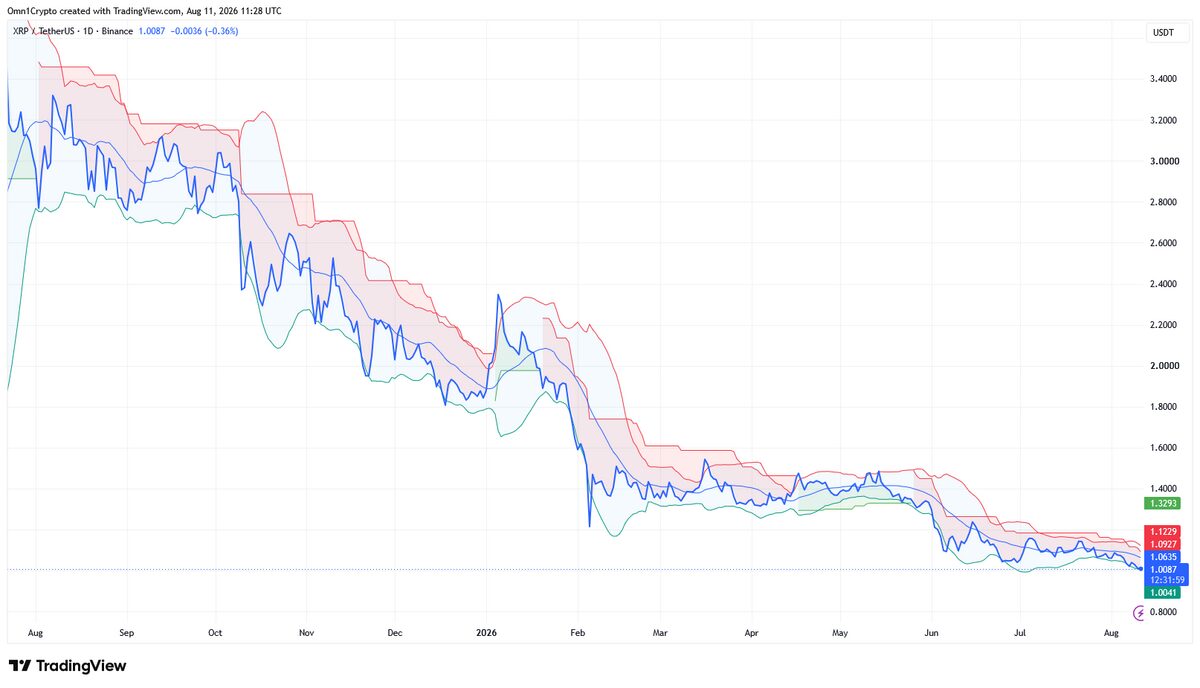
XRP is sitting near $1.03, but one chart analyst is arguing the token is quietly repeating the exact multi-year structure that preceded its legendary 2017 breakout.
The same pattern appeared before the 2017 run, when the token eventually exploded more than 60,000–70,000% from its lows. She claims the current setup is now approaching its third major retest of that line — the point that historically marked the start of the expansion phase.
The Three-Step Roadmap
For the crypto crowd on X to observe, the technical analyst laid out a clear, staged path:
Scenario 1 (Aug–Sep)
$1.10 → $0.97 → $1.80
A near-term dip toward the high $0.90s is expected to complete the current retest, followed by a recovery that pushes XRP back above $1.80.
Scenario 2 (Nov–Dec)
$1.80 → $2.70 → $3.20
If the first recovery holds, the next leg would target the previous cycle highs and slightly beyond.
Scenario 3 (Jan–Feb)
$3.20 → $6.50 → $13.00
The final expansion phase, where the structure fully unlocks and XRP makes a much larger move.
According to the analysis, once the third retest of the multi-year support successfully holds, the “expansion phase begins.”
Why The Comparison Makes Sense
The XRP price chart overlay shows striking similarities between the 2014–2017 accumulation and the structure that has been building since roughly 2020. In both cases, price created a higher-low trendline, retested it multiple times, and only after the third successful defense did the real upside acceleration begin.
Of course, fractal analysis looks fancy, but it’s not really a guarantee. Markets evolve, liquidity is different, and regulatory or macro conditions can override pure technical patterns. Still, the visual rhyme is hard to ignore for traders who follow long-term cycle structures.
Right now, the price of XRP remains well below its 2025 highs near $3.65 and has spent much of 2026 grinding lower.
Whether the current level around $1.03 ultimately proves to be the final shakeout before a larger recovery — or simply another leg in a longer consolidation — will depend on whether that multi-year support continues to hold.
For now, the fractal chart analyst’s message is straightforward: bookmark the chart and revisit it in a few months. If the third retest holds, history may be setting up for another dramatic chapter.