
Is the Turning Point for the US Dollar Coming? 2024 vs 2026

Morning FX
The US Non-Farm Payrolls data for July, released last Friday, was much lower than expected, triggering a decline in the US dollar and US Treasury yields. Both the catalyst and market behavior are reminiscent of the summer of 2024, with strong similarities in the fundamentals, external environment of yen intervention, and technical analysis.
Similarity 1: Weakening Labor Market
The trigger for both rounds of market movement came from July's weaker-than-expected Non-Farm Payrolls data.
On August 2, 2024, the July Non-Farm Payrolls showed an increase of just 114,000 jobs, significantly below the market expectation of 175,000. The unemployment rate rose from 4.1% to 4.3%, directly triggering the “Sahm Rule”, with recession fears for the US economy rapidly intensifying. Additionally, the Bureau of Labor Statistics subsequently revised down the past year’s payrolls numbers by 818,000, clearing the way for the Federal Reserve to begin rate cuts.
The July Non-Farm Payrolls released on August 7, 2026, unexpectedly showed a decrease of 23,000 jobs, far short of the 80,000 expected. The combined data for May and June were revised downward by 103,000, and the three-month average increase is only 20,000, clearly showing a cooling labor market. However, the unemployment rate from household surveys fell for two consecutive months to 4.1%, indicating the labor market has not seen a severe wave of layoffs.
Similarity 2: Federal Reserve Rate Expectations Shift
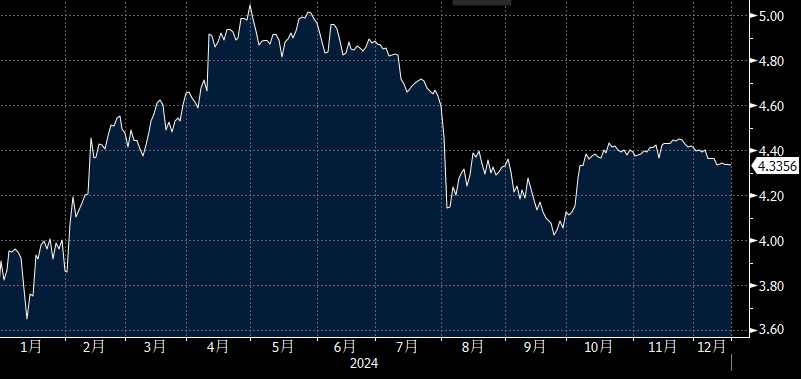
2024 Rate Cut Expectations: 7 times → 1 time → 5 times, with an actual total cut of 100bp (50bp in September, 25bp in November, 25bp in December)
Overly dovish pricing: At the beginning of 2024, the market priced in up to 170bp of cumulative rate cuts by the end of 2024.
Hawkish repricing: However, as inflation was persistently higher than expected and the labor market remained resilient, expectations for rate cuts were continually delayed. By June 2024, the market was pricing only one rate cut during the year.
Dovish pivot again: From July to September 2024, as the labor market weakened, inflation fell, and Powell gave a clear signal at the Jackson Hole symposium, the Federal Reserve delivered a larger-than-expected 50bp cut in September.
Figure 1: Interest Rate Futures Market’s Rate Expectations for End-2024 (2024)
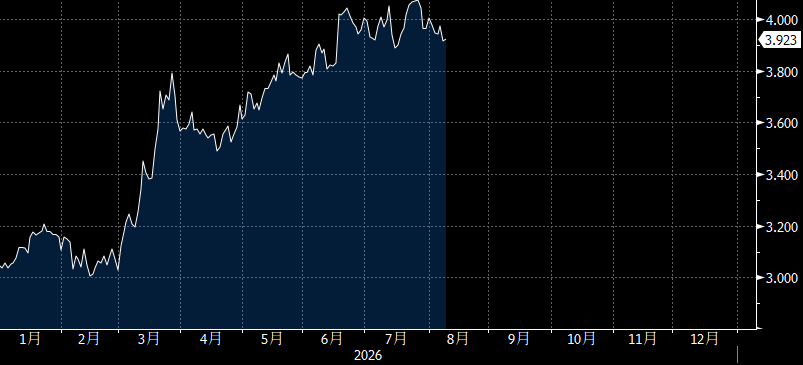
2026 rate hike/cut expectations: Two cuts → two hikes
Rate hike expectations rise continuously: Due to factors such as US-Iran geopolitical tensions pushing oil prices higher and AI infrastructure investment driving industrial demand, US inflation rose. The market shifted from pricing in rate cuts at the start of the year to rate hikes.
But after this negative payrolls number, rate hike expectations did not fall significantly, mainly due to inflation concerns: In 2024, inflation continued to decline, giving the Fed confidence to cut rates. Currently, however, inflation remains high, with July core PCE annualizing at 3.3%. This creates a stagflation scenario alongside weak jobs data, making a shift to a dovish stance more challenging for the Fed.
Figure 2: Interest Rate Futures Market’s Rate Expectations for End-2026 (2026)
Similarity 3: Yen Exchange Rate Intervention
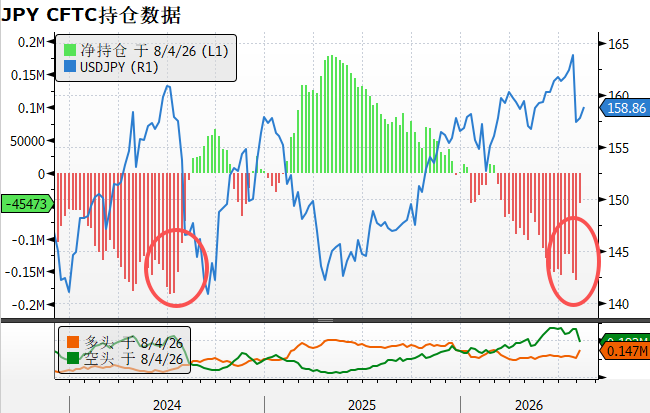
In July 2024, after US June CPI came in below expectations, the BOJ seized the opportunity of the weaker dollar to intervene in the yen exchange rate, suppressing USD/JPY long positions and contributing to a temporary decline in the dollar.
After the July 2026 FOMC rate decision, the US and Japan began joint exchange rate intervention, triggering the unwinding of yen carry trades, which also acted as a short-term factor pushing down the US dollar index.
Figure 3: CFTC Yen Positioning Shows Large Short Covering on Yen
Similarity 4: Retreat in Dollar Long Positioning
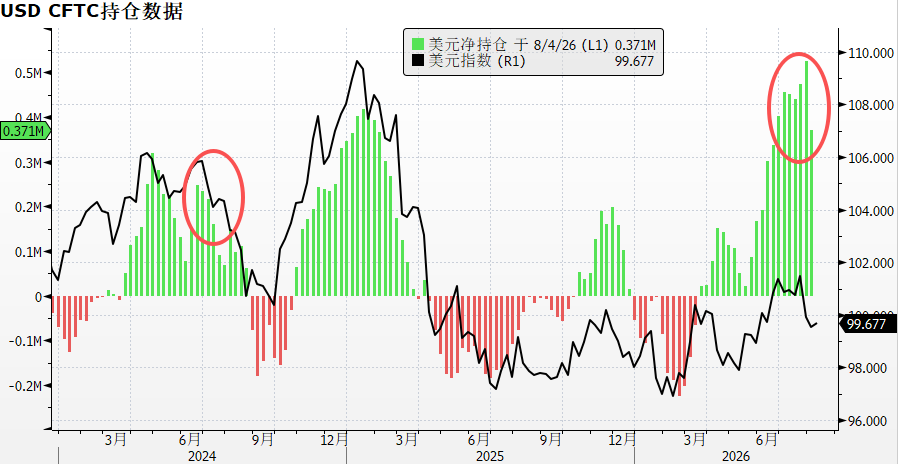
CFTC non-commercial positioning shows that in the summers of both 2024 and 2026, net long positions in the dollar retreated sharply from highs, albeit with more crowded long positions in 2026.
Figure 4: US Dollar Long Positions Retreat from Highs
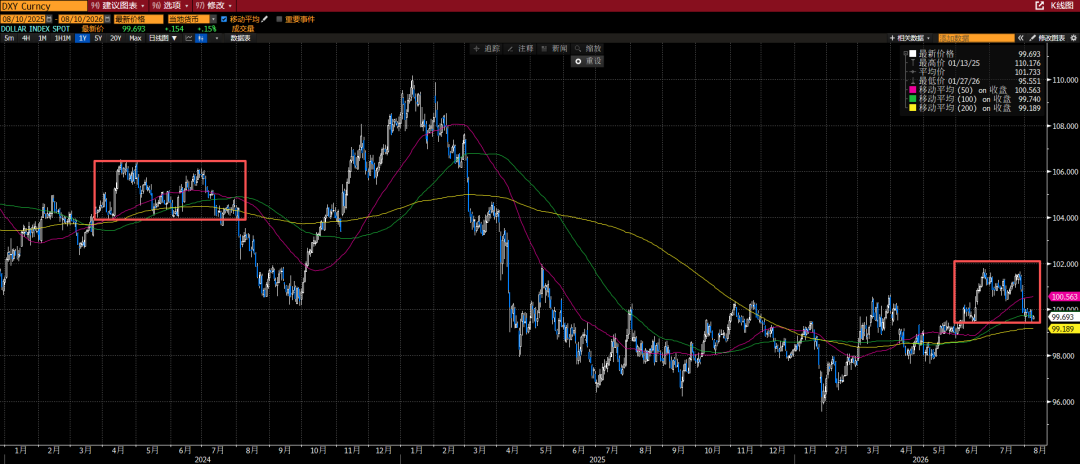
Similarity 5: US Dollar Index Forms “Double Top” in Technical Patterns
In 2024, the dollar index formed a double top at the 106 level, and after breaking the neckline at 104 in August, continued to fall, with a cumulative drop of 6% from the July peak to the end of September.
In 2026, the dollar index formed a double top at 101.8 and is currently fluctuating near the support at 99.5. If this support line is broken, further downside is expected.
Figure 6: US Dollar Index Movement: 2024 vs 2026
Summary:
Both 2024 and 2026 have shown signals of weakening employment, but the difference lies in inflation.
2024 was a standard economic cooling cycle, with inflation steadily declining towards the 2% target, and a weakening labor market presented an excellent opportunity for the Federal Reserve to turn accommodative;
In contrast, even though economic data turned cold in 2026, inflation remained high. Coupled with hawkish divisions inside the FOMC, the Fed could not smoothly pivot to a dovish, accommodative stance. This is also why the dollar's reaction to this negative NFP data was limited.
The July CPI data to be released on August 12 will be a dividing line for the market. If inflation data comes down significantly, then after breaking below the double top’s support and the key 200-day moving average at 99.2, the US dollar index may enter a clear downward trend.
Disclaimer: The content of this article solely reflects the author's opinion and does not represent the platform in any capacity. This article is not intended to serve as a reference for making investment decisions.
You may also like
The Source of Massive Capital Expenditures: How High Is the “Hidden Leverage” of Tech Giants?
Research by Goldman Sachs and Morgan Stanley indicates that AI cloud providers such as Alphabet, Microsoft, Amazon, and Meta have approximately $2 trillion in off-balance-sheet implicit liabilities, including $1 trillion in unexecuted lease commitments and nearly $1 trillion in procurement commitments. If data center investment returns fall short of expectations, these implicit liabilities will exert substantial pressure on liquidity, and the bond market has already shown mild correction signals.
Jensen Huang personally "lobbies" Wall Street: Nvidia (NVDA.US) joins forces with six major giants to turn GPUs into "golden egg-laying real estate," aiming to tap into the $500 billion compute power collateralized loan market
Nvidia (NVDA.US) is attempting to position its AI chips as Wall Street's latest asset class. The company has reached partnerships with six major asset management firms, aiming to advance a financing plan with a scale of $500 billion.

Responding to the “$500 billion financing question”! Jensen Huang: Nvidia’s “AI factories” are becoming “investment-grade assets”; real demand exists and it is definitely not “circular financing”
Jensen Huang refers to the funds as third-party capital, stating that financial institutions will conduct independent due diligence, and emphasizes that the demand for AI is real. NVIDIA’s "AI Factory" possesses long-term economic value and a broad ecosystem. NVIDIA has joined forces with six major financial institutions, including Apollo, BlackRock, and Blackstone, to establish an independent financing platform. "Dr. Doom" Chanos compared this situation to the 2008 financial crisis: "When these people sit together at the same table to explain AI financing next time, it might be at a congressional hearing in 2031..."
Wall Street Shouts: U.S. Stock Cybersecurity Sector in “Early Stage” of Value Reassessment! AI Ignites Network Defense Demand, Black Hat Conference Catalyzes Concept Stock Surge
After the Black Hat cybersecurity conference highlighted the escalating threats posed by artificial intelligence, U.S. cybersecurity stocks surged.

Crypto prices
More


