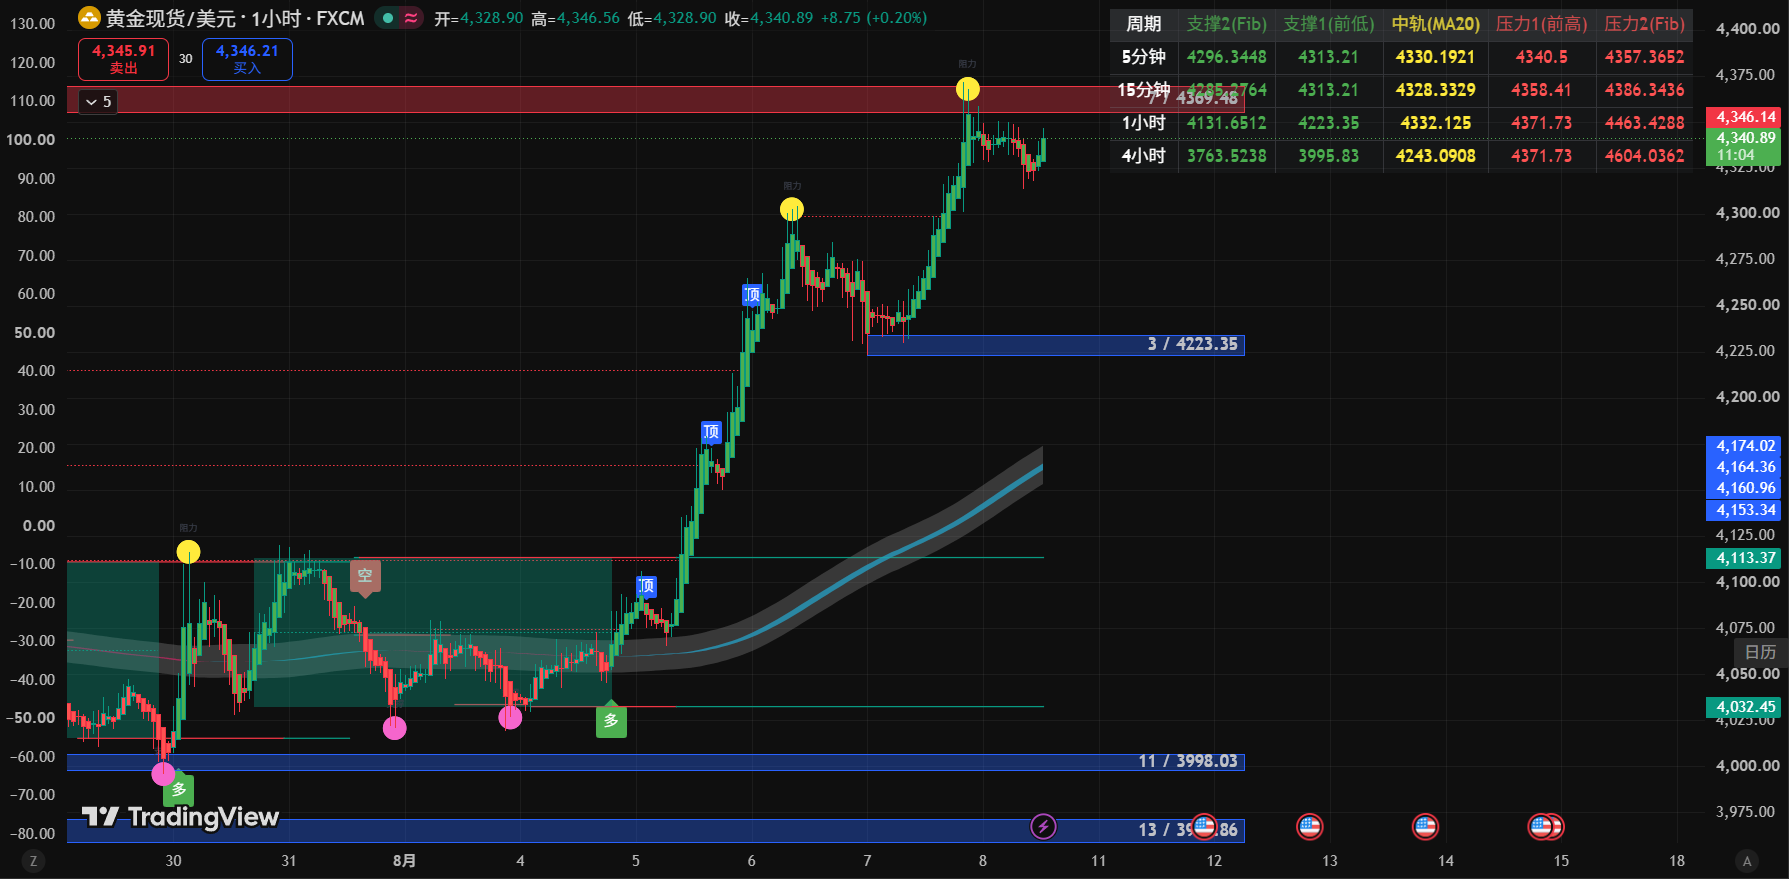
1-hour candlestick chart
1. News: Non-Farm Payrolls Positive Digested & Profitable Positions Resonance at Highs
Over the past 24 hours, following last week's strong surge, the international gold market entered a consolidation phase. The core influencing factors are as follows:
Non-Farm Payrolls Data Bearish USD, Bullish for Gold (Slightly Bullish): The market continues to digest previously soft employment data and expectations of Fed rate cuts. Long-term safe-haven and anti-inflation funds maintain allocation demand for gold.
Profit-Taking at Highs Emerges (Bearish): After gold prices hit a record high of 4371 USD, some short-term highly leveraged capital and large profitable investors chose to exit to lock in gains, leading to an increase in technical selling pressure.
Geopolitical Sentiment Temporarily Stable (Neutral/Bearish): No further deterioration from sudden geopolitical events in the short term; market sentiment shifts from risk aversion to technical correction and adjustment.
2. Technical Analysis: Peak Signals Triggered, Short-Term Correction Expected
Based on the reference 1-hour candlestick chart, key technical indicators are analyzed as follows:
Candlestick Patterns & Trends: Gold previously surged from 4060 with sustained volume in a main upward wave, peaking at 4371 USD and showing a “Nine Reversal Sequence (green 13)” topping signal at the high. Subsequently, consecutive bearish candles pulled back, with the latest quote at 4325.26 USD.
Moving Average System (MA):
MA5 (4330) and MA10 (4334) have formed a death cross on the upper side, suppressing price, which is currently trading below short-term moving averages.
MA30 (4303) is becoming the first key support line for price pullback.
MA52 (4286) remains gently upward; the overall major trend is still bullish, but the short-term has entered a consolidation/correction pattern.
Key Support/Resistance Levels:
First Resistance: 4371 USD (previous highest point).
First Support: 4300 - 4303 USD (1-hour MA30 and psychological round number).
Second Support: 4280 - 4286 USD (1-hour MA52 strong support zone, i.e., “resistance-support swap area”).
Oscillator Indicator (RSI): At the bottom, RSI2 is 55, RSI3 is 59; indicators have fully retreated from previous overbought zone to neutral range of 50–60, signaling weakened short-term bullish momentum and short-term bears taking charge.
3. Trading Strategy: No Chasing Longs, Wait for Pullback Stabilization
1. Specific Price Recommendations
First Entry Point (Buy on Dip): 4295 - 4300 USD (attempt light positions for longs if MA30 holds and price doesn’t break below 4290).
Main Entry Point (Strong Support Long): 4280 - 4290 USD (add positions after confirming stabilization on MA52).
First Take-Profit Target: 4330 - 4335 USD.
Strict Stop-Loss: 4275 USD (a break below 4275 USD means the hourly uptrend line is broken; cut losses immediately).
2. Position Management Strategy
Total Position Control: Suggest total funds allocated within 10%.
Batch Allocation: Try 5% position near 4300, add another 5% if confirmed stabilization at 4285; strictly avoid bottom fishing at high levels.
4. Risk Warning & Countermeasures
Risk of Steep Bearish Drop at High Levels:
Risk Manifestation: After TD13 signal triggered at 4371, if 4300 is broken, chain stop-loss liquidation may be squeezed, rapidly plunging to the 4250 area.
Countermeasure: Absolutely avoid holding without stop-loss; once entering any long position, set a hard stop-loss below 4275.
Risk of Narrow-Range Pullback & Shakeout:
Countermeasure: Wait until 1-hour candlestick closes with a confirmatory bullish candle before manual entry, avoid blindly catching falling knives during big bearish candles.