
Monster: Skyrocketing Valuation, How Long Can the "Sweet Period" Last for Monster?


Monster Beverage (MNST) released its Q2 2026 financial results in the early morning of August 7, 2026, Beijing time (post-market on August 6, US Eastern Time). Overall, Monster’s second quarter performance remains strong,with both revenue and gross margin exceeding expectations. However, the issue lies in increased marketing spending, aimed at attracting family consumers, which led to operating profit slightly missing forecasts.
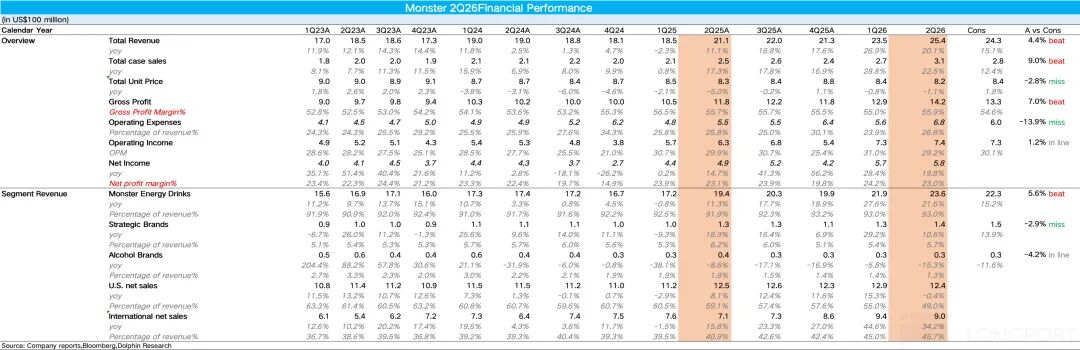
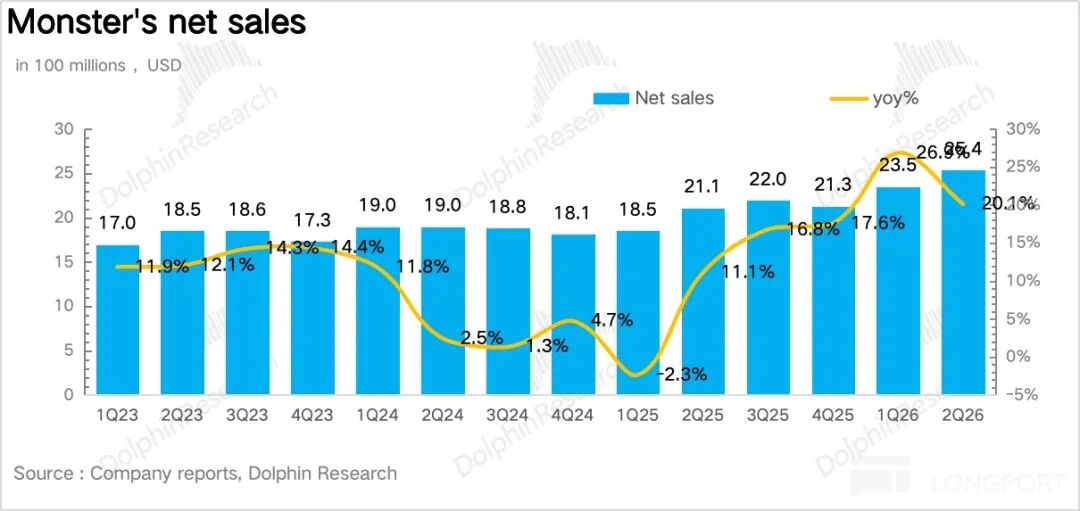
1. Revenue significantly exceeds expectations, sales volume remains the core driver.In 2Q26, Monster achieved sales of $2.54 billion, a year-on-year increase of 20.2% (consensus +15.1%), with foreign exchange contributing $48.5 million. Excluding forex, growth was 17.9%.
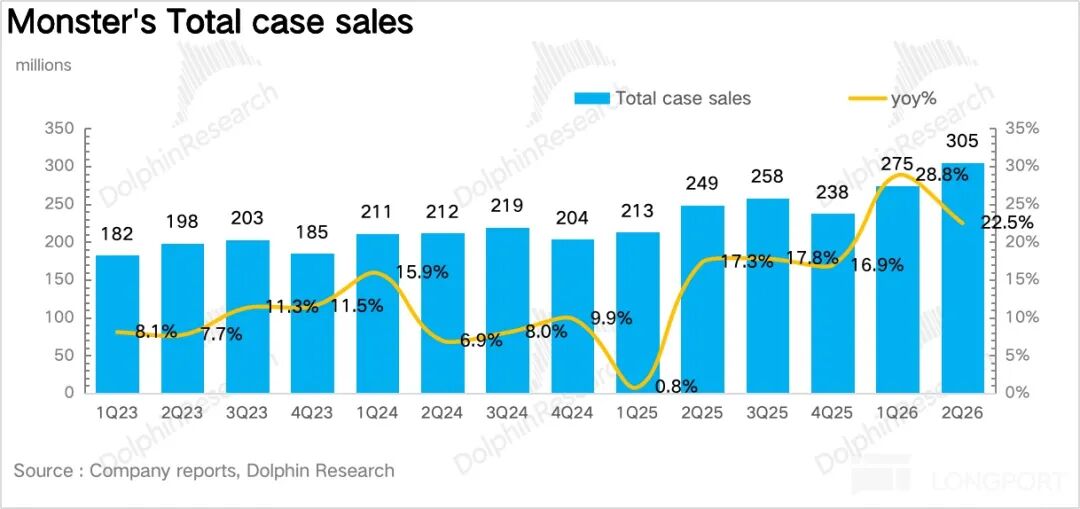
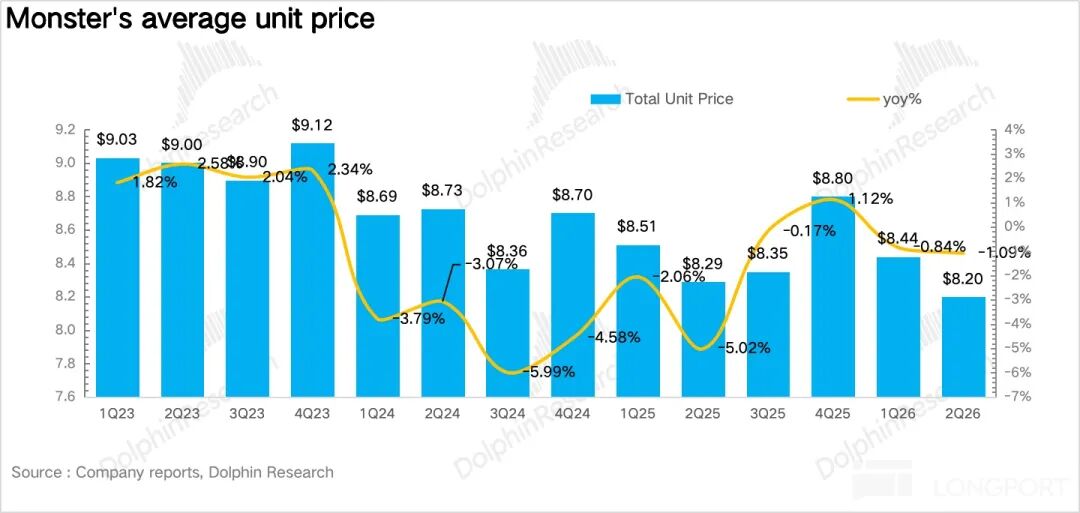
In terms of volume and price breakdown, total case sales rose 22.5% YoY to 305 million cases, remaining the absolute core driver. Price per case dropped by 1.1% YoY to $8.20/case, primarily because of a significant rise in low-price international market share (increased by 5 percentage points, reaching 45.7%).
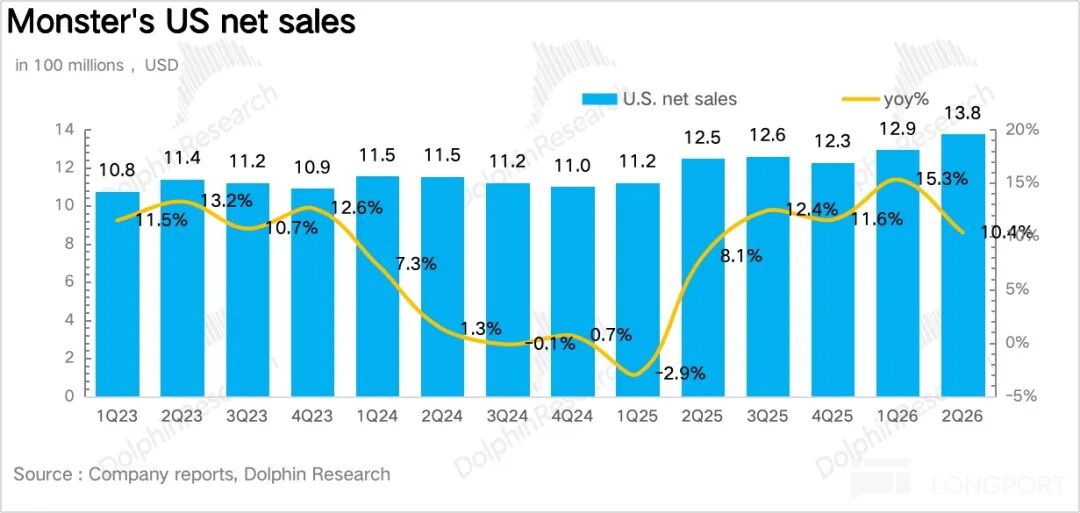
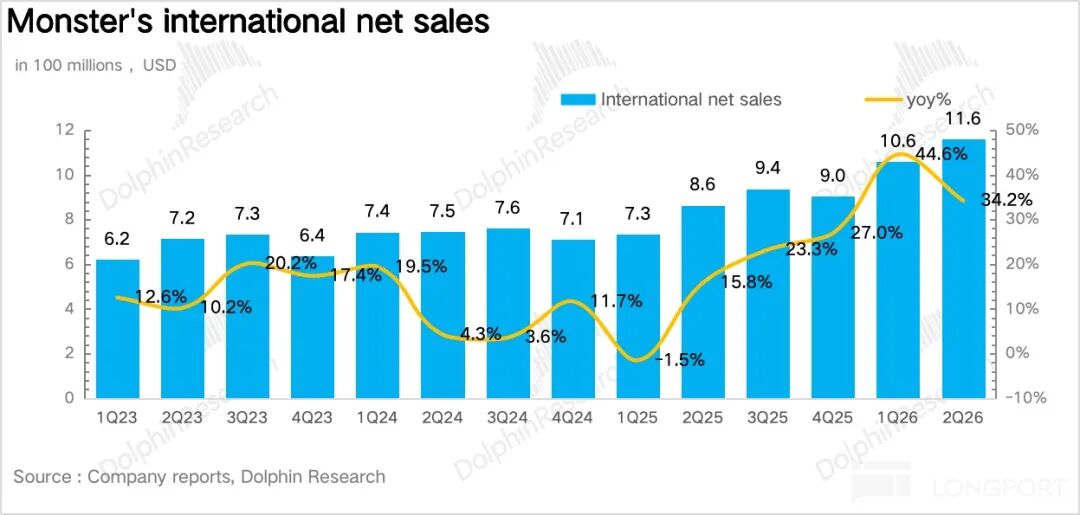
2. International markets continue high growth, but the US remains robust.By region, North America achieved Q2 revenue of $1.38 billion, a 10.4% YoY increase. Growth in international regions reached 34% YoY, with share rising 4.8 percentage points to 45.7%,especially notable in the EMEA region, which saw more than double the market category average growth. Additionally, the company achieved share gains in Brazil, China, and India. (Brazil +82%, India +84%, China +62.5%).
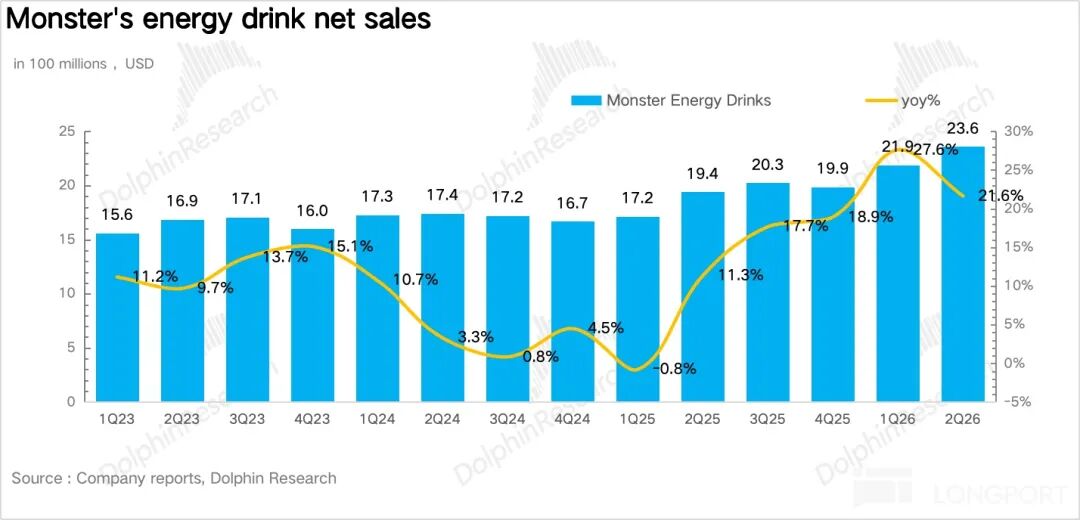
3. Main brands surpass strategic brands; new products are the main contributors.By brand, Monster Energy beverages grew by 21.6% YoY,
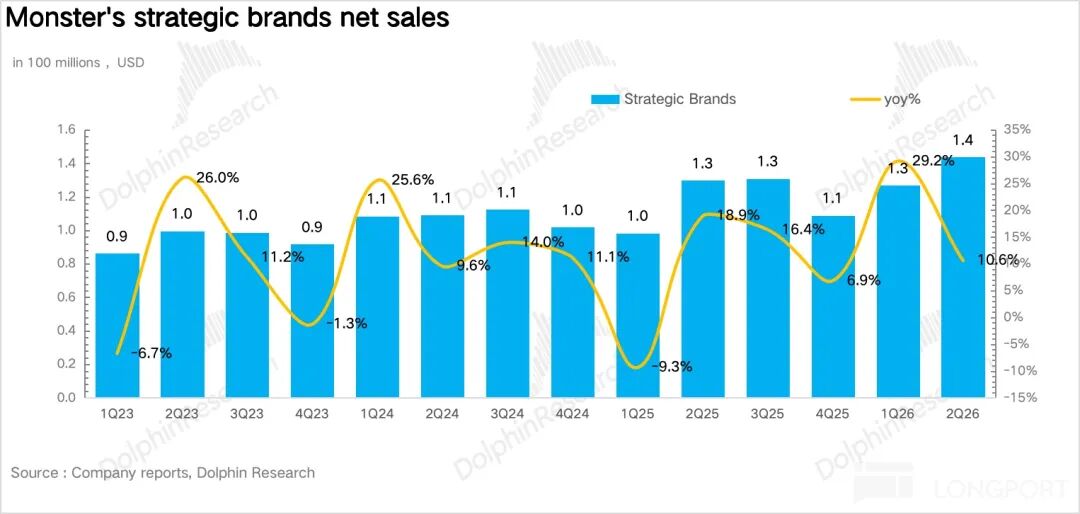
The primary increment came from new products — according to Nielsen, Ultra grew 19%. In total, 7 new SKUs accounted for 10% of US tracked channel sales in Q2, and contributed 85% of Monster family brand growth in H1. Strategic brand growth was mediocre, only 10.6% YoY, indicating a clear slowdown.
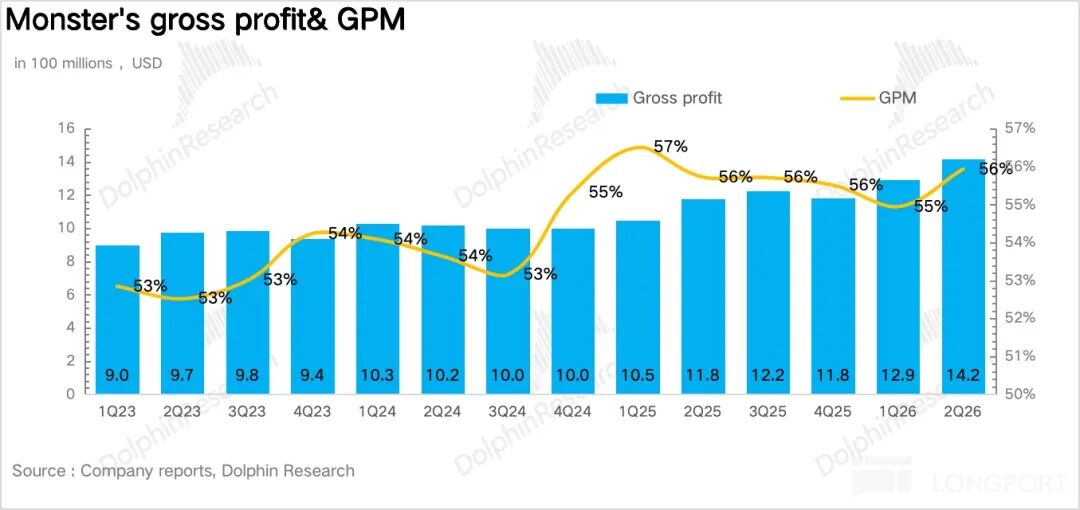
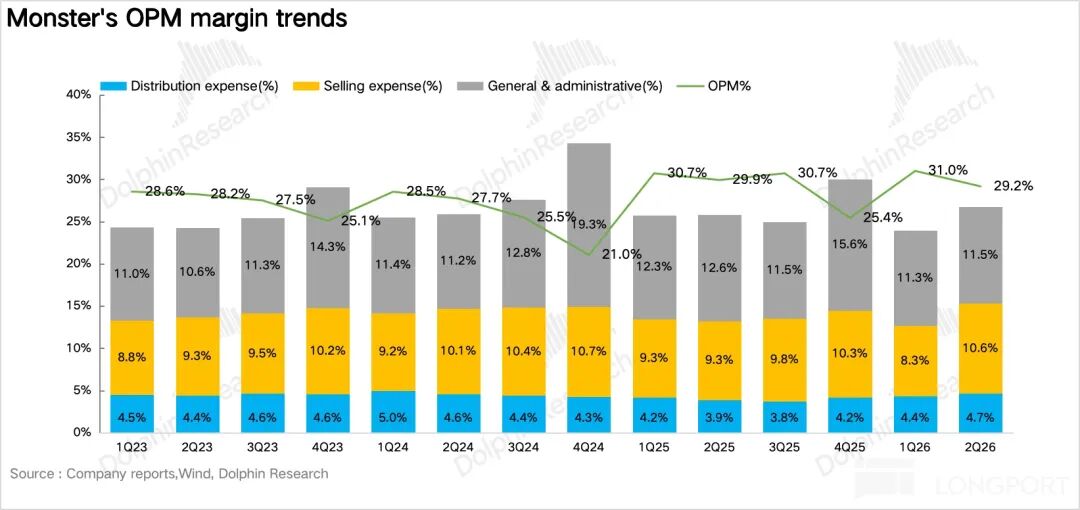
4. Gross margin unexpectedly turns positive, but operating leverage did not keep pace this time.Despite increased aluminum can costs and higher freight rates, the realization of price hikes and improved sales mix helped gross margin rise 0.2 percentage points YoY to 55.9%. On the cost side, with heavier investments in social, digital, media marketing, and sponsorships to boost family penetration, selling expenses rose 36.7% YoY, raising the expense ratio by 1 percentage point to 26.8%, below market expectations.
5. Overview of financial indicators
Dolphin’s Overall View:
Three months ago, in the Q1 earnings review, Dolphin concluded that “compared to the peak valuations during Java (2012) and Ultra (2018) launches, there was room to move toward a 40x multiple and $92 billion market cap, implying a 16% upside potential.”This target was already reached by mid-July:
Based on information from this quarter’s earnings call — "new products contributed 85%" — it further verifies the logic of Monster’s 2026 product innovation cycle.But viewed from another angle, it also suggests that the natural growth of classic products like Monster, Java, Rehab is now minimal. Next year, as this batch of new products hits a higher comparative base, for the US business to sustain double-digit growth, another wave of major innovation will be needed, which Dolphin sees as a challenge.
Another positive is that although the average price per case for Monster is declining, gross margin is rising. Dolphin believes this shows that last year’s price increases are beginning to reflect in the numbers, and there are also benefits from a better brand mix.
Therefore, average price per case is no longer an effective “quality” indicator for Monster at this stage.This figure now mixes opposing effects from region and product structure. Going forward, attention should focus on “relative growth of Monster Energy segment versus strategic brands” and the gross margin itself. It’s positive that both indicators improved this quarter.
As for the increased marketing expenses this quarter, Dolphin considers thatgiven 2026 is Monster’s major product innovation year and this season’s new products performed exceptionally well, there’s no blame from an ROI perspective for this spend.
However, looking ahead, any further improvements in operating margin will rely on gross margin increases, while the pressure of aluminum can costs remains—management made it clear that, based on current aluminum prices and Midwest premiums, aluminum costs are expected to edge up each quarter through the end of 2026.
Detailed Analysis Below
I. Investment Logic Framework
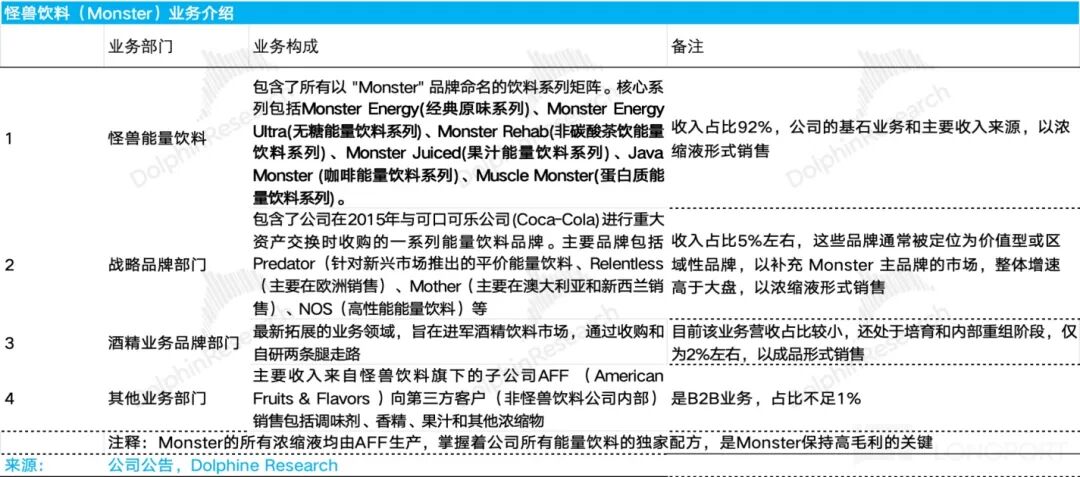
According to Monster's official disclosures, company revenue growth can be broken down into four main business units: Monster Energy, Strategic Brands, Alcoholic Beverage Brands, and Other Businesses. Among them:
(1) Monster Energy segment: The company's cornerstone business and primary revenue source, currently accounting for about 92% of revenue. This segment covers all drinks under the "Monster" brand umbrella.The core lineup includes Monster Energy (original classic series), Monster Energy Ultra (sugar-free energy drinks), Monster Rehab (non-carbonated tea energy drinks), Monster Juiced (juice energy drinks), Java Monster (coffee energy drinks), and Muscle Monster (protein energy drinks).
(2) Strategic Brands segment: Mainly includes a range of energy drink brands acquired from Coca-Cola in a major asset swap in 2015. These brands are usually positioned as value or regional offerings to complement Monster’s main brand. Key brands include Predator (affordable energy drinks targeting emerging markets), Relentless (mainly sold in Europe), Mother (mainly sold in Australia and New Zealand), NOS (high-performance energy drink), etc. The strategic brands segment now accounts for about 5% of revenue, growing slightly faster than the group average.
(3) Alcoholic Beverage Brands segment: Monster’s newest business foray, aiming to enter the alcoholic drink market through both acquisitions and in-house development. This segment is still small, making up only about 2% of revenue, and remains in its cultivation and internal restructuring phase.
(4) Other Businesses segment: The smallest revenue contributor, mainly from AFF (American Fruits & Flavors), a Monster subsidiary, which sells flavors, extracts, and other concentrates to third-party customers (outside Monster). This is a B2B business. Importantly,all Monster liquid concentrates are produced by AFF, which also holds Monster’s exclusive energy drink formulas—this is key to the group’s high gross margins.
II. Key Charts Overview
- END -
// RepostKaibai

Writing is not easy, click“Share” to cheer me up~
Disclaimer: The content of this article solely reflects the author's opinion and does not represent the platform in any capacity. This article is not intended to serve as a reference for making investment decisions.
You may also like
Johnson & Johnson Stock Holds Bullish Trend, But MACD Signals Fading Momentum
Analyst warns XRP will underperform Bitcoin for rest of year after breakdown
Remitly Global, Inc. stock hits record $115M EBITDA, then reverses hard
AeroVironment, Inc. stock jumps to $186.73, but $205 ceiling still looms
Crypto prices
More


