
Alphabet Stock Posts 21.8% Revenue Growth — So Why Won’t It Break Out?

Alphabet Stock trades at $358.89 as of July 9, caught between strong fundamentals and a hesitant technical setup. GOOGL sits just below its short-term moving averages, with momentum indicators confirming neither breakout nor breakdown. The tension between 21.8% revenue growth and neutral technicals defines the current outlook.
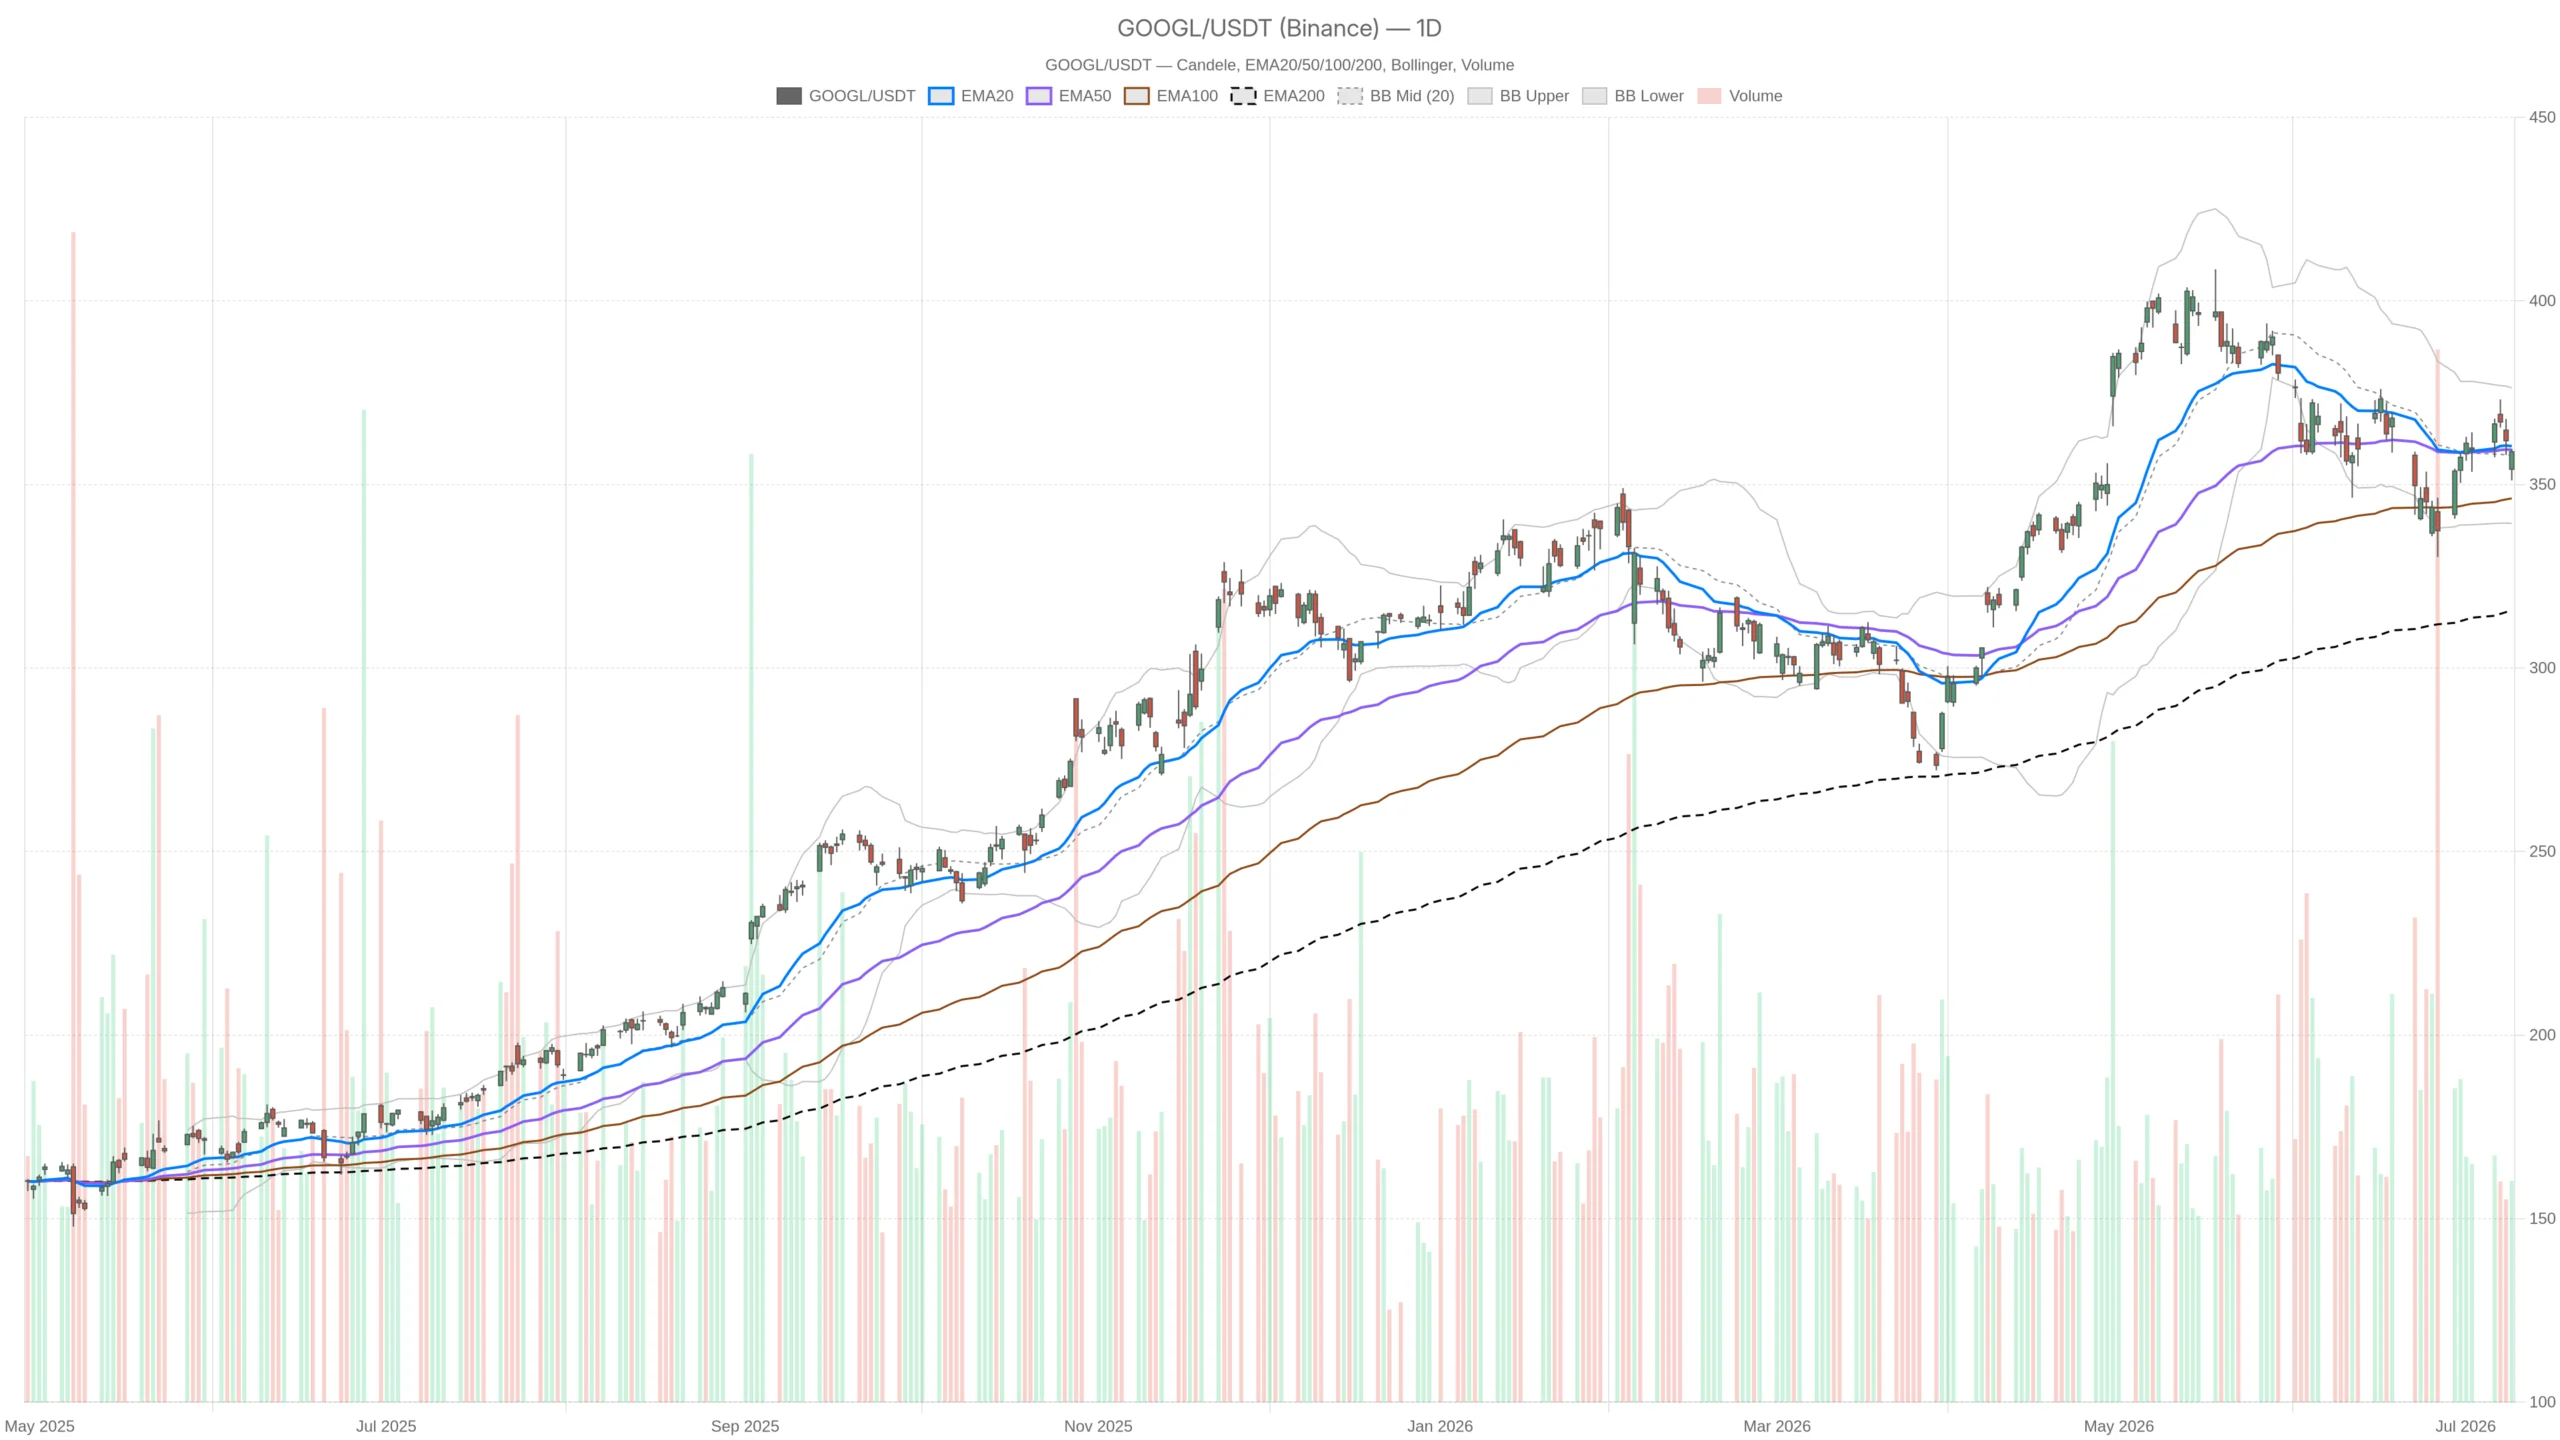 GOOGL — daily chart with candlesticks, EMA20/EMA50 and volume.
Summary
- Key takeaways
- Daily Timeframe: Alphabet Stock Holds a Neutral Regime
- Hourly View: Short-Term Pressure Complicates the Picture
- 15-Minute Frame: Short-Term Momentum Flickers Higher
- Fundamental Context: AI Narrative Supports the Bull Case
- Bullish Scenario: What Would Need to Happen
- Bearish Scenario: What Would Invalidate the Bull Case
- Positioning and Final Read
- FAQ
Key takeaways
- GOOGL closed at $358.89 on July 9, below both the EMA20 ($360.44) and EMA50 ($359.46) on the daily timeframe.
- The daily RSI14 at 48.17 sits mid-range and neutral, while the MACD histogram has turned positive, signaling decelerating bearish momentum.
- Alphabet reported revenue of $109.90 billion, up 21.8% year over year, with cloud growing 63%.
- The $359–$362 zone forms the critical near-term resistance cluster that must break for a bullish shift.
- ATR14 on the daily is $11.82, indicating elevated volatility that can punish poorly timed entries.
Daily Timeframe: Alphabet Stock Holds a Neutral Regime
GOOGL’s daily bias is clearly neutral. The stock closed at $358.89, below both the EMA20 at $360.44 and the EMA50 at $359.46. Price trading beneath these near-term averages signals the short-term trend has not yet reasserted to the upside.
Moving Averages and Momentum Signals
However, the EMA200 at $315.65 tells a very different story on a longer horizon. Price trades roughly $43 above it, confirming the structural bull trend remains intact. The RSI14 on the daily sits at 48.17 — effectively mid-range, leaning slightly bearish. It neither suggests oversold exhaustion nor overbought excess.
Meanwhile, the MACD configuration adds a subtle constructive note. The MACD line at -1.75 remains negative, but the histogram has turned positive at 1.48. That histogram flip indicates bearish momentum is decelerating. It is not a buy signal in isolation. Still, it suggests selling pressure is fading.
Volatility and Pivot Structure
Bollinger Bands on the daily frame are wide, with the upper band at $376.30 and the lower at $339.39. The midline sits at $357.84, just below current price. GOOGL trading near the midline reinforces the neutral read. ATR14 at $11.82 reflects meaningful daily volatility. Moves of that magnitude are routine. Traders should account for that range when defining risk.
The daily pivot structure is tight. The pivot point sits at $356.54, with R1 at $362.00 and S1 at $353.43. GOOGL closed above the pivot — a marginal positive. A confirmed hold above $362.00 would open the door to a more meaningful bullish development.
Hourly View: Short-Term Pressure Complicates the Picture
The 1H chart is more cautious than the daily. Price has not reclaimed the hourly EMA200, keeping the intraday structural trend technically bearish. On this timeframe, the EMA200 sits at $363.66, well above the current price of $358.87 — a notable divergence from the daily structure.
The EMA20 at $359.49 and EMA50 at $359.18 are clustered just above current price. They form an immediate layer of resistance. The hourly RSI at 47.82 mirrors the daily almost exactly — neutral, with a faint bearish tilt. Meanwhile, the MACD on the 1H is negative on both the line (-1.39) and the histogram (-0.57). This contrasts with the constructive histogram on the daily.
That divergence between timeframes is worth noting. The daily MACD histogram is improving. The hourly MACD histogram is still deteriorating. In practice, the recovery attempt visible on the daily has not yet filtered through to intraday momentum. The 1H reading weakens, but does not invalidate, the daily thesis.
At the same time, the hourly Bollinger midline at $361.41 sits above current price. This is consistent with the broader resistance cluster between $359 and $363. ATR14 on the hourly is $2.97, indicating moderate intraday movement. The hourly pivot at $358.70, with R1 at $359.46, shows price in a compressed intraday range. This signals consolidation rather than directional conviction.
15-Minute Frame: Short-Term Momentum Flickers Higher
The 15-minute chart offers the most constructive short-term signal. RSI14 has pushed into mildly bullish territory, and the MACD crossover suggests intraday buyers are stepping in. RSI14 at 62.71 confirms the shift into bullish territory on this compressed timeframe.
The MACD histogram at 0.61 is positive and expanding. The MACD line at 0.17 has crossed above its signal line at -0.44. That crossover is an early indication of buyers stepping in near the session lows. Price has pushed above the 15m EMA20 ($356.81), EMA50 ($358.24), and EMA200 ($358.23). All three are tightly clustered — a configuration that typically precedes a short-term directional move.
Notably, the 15m Bollinger upper band at $359.32 aligns almost precisely with the hourly R1 at $359.46. That confluence makes $359–$359.50 the key short-term inflection point. A clean break there on volume could catalyze a move toward the daily R1 at $362.00.
Fundamental Context: AI Narrative Supports the Bull Case
Alphabet’s fundamentals provide a credible backbone for the bull case. Revenue growth of 21.8% and 63% cloud expansion represent genuine operating momentum at scale. Revenue of $109.90 billion was up 21.8% year over year. Cloud grew 63%. CEO Sundar Pichai described the company’s AI investments and full-stack approach as driving performance across the business. These are not marginal numbers.
ClearBridge Investments recently adjusted its portfolio weightage in Alphabet as part of its Large Cap Growth Strategy commentary for Q2 2026, citing equity market strength fueled by robust earnings. Lakehouse Capital similarly highlighted strong cloud performance in its investor letter for April 2026.
Meanwhile, a comparative analysis from Yahoo Finance argues that Alphabet’s unmatched distribution positions it as a stronger long-term AI investment than Meta. The narrative around GOOGL as a core AI infrastructure play remains firmly in place.
Bullish Scenario: What Would Need to Happen
For the bullish case to materialize, GOOGL must reclaim the EMA20 and EMA50 on the daily — currently at $360.44 and $359.46. A daily close above $362.00 would mark a meaningful technical shift. At that point, the MACD histogram improvement on the daily would be validated by price action, not just momentum deceleration.
The strong fundamental backdrop — particularly the AI and cloud growth story — provides a logical reason for institutional buyers to add exposure on dips. If the 15m momentum continues to build and volume confirms a push through the $359–$362 resistance cluster, the setup becomes increasingly actionable for bulls. The upper Bollinger Band on the daily at $376.30 would then emerge as a realistic medium-term target.
Bearish Scenario: What Would Invalidate the Bull Case
The bearish case is not without merit. Price remains below the daily EMA20 and EMA50, and the hourly MACD histogram is still negative. The 1H EMA200 at $363.66 represents a heavier structural resistance ceiling.
If GOOGL fails to hold the daily pivot at $356.54 on a closing basis, the S1 at $353.43 comes into focus quickly. A deeper pullback would bring the lower Bollinger Band at $339.39 into scope. That scenario would likely require a broader market deterioration or a negative catalyst specific to Alphabet.
Notably, GOOGL saw a -1.35% decline on July 8, underperforming the broader market that session. That relative weakness deserves monitoring. If the pattern repeats while the resistance cluster holds, it would cast doubt on the recovery thesis.
Positioning and Final Read
Overall, Alphabet Stock presents a story of potential without confirmation. The hierarchy of signals argues for patience over aggression. The daily regime is neutral. The hourly setup is cautiously bearish. Only the 15-minute frame shows early signs of a bid.
The macro story — 21.8% revenue growth, 63% cloud expansion, a credible AI narrative — supports the structural bull thesis. Technically, however, the price has not yet proven it deserves a re-rating. The $359–$362 zone matters most in the near term. How GOOGL behaves around that cluster will determine whether consolidation resolves as a launchpad or a failed rally. Volatility, as the ATR figures confirm, remains elevated enough to punish poorly timed entries on either side.
FAQ
What is the current bias for Alphabet Stock on the daily timeframe?
The daily bias is clearly neutral. GOOGL closed at $358.89, below both the EMA20 at $360.44 and the EMA50 at $359.46. The RSI14 sits at 48.17, mid-range and leaning slightly bearish. However, the MACD histogram has turned positive, indicating decelerating bearish momentum, while the EMA200 at $315.65 confirms the structural bull trend remains intact.
What are the key resistance levels GOOGL must break for a bullish reversal?
GOOGL must reclaim the EMA20 ($360.44) and EMA50 ($359.46) on the daily timeframe. A daily close above $362.00 (daily R1) would represent a meaningful technical shift. On the hourly chart, the EMA200 at $363.66 forms a heavier structural resistance ceiling. The $359–$362 zone is the critical near-term cluster to watch.
How do Alphabet’s fundamentals support the stock’s outlook?
Alphabet reported revenue of $109.90 billion, up 21.8% year over year, with cloud growing 63%. CEO Sundar Pichai cited AI investments and the full-stack approach as driving performance. External fund managers, including ClearBridge Investments and Lakehouse Capital, have highlighted Alphabet’s strong earnings and cloud performance in recent commentary.
{"@context":"https://schema.org","@type":"FAQPage","mainEntity":[{"@type":"Question","name":"What is the current bias for Alphabet Stock on the daily timeframe?","acceptedAnswer":{"@type":"Answer","text":"The daily bias is clearly neutral. GOOGL closed at $358.89, below both the EMA20 at $360.44 and the EMA50 at $359.46. The RSI14 sits at 48.17, mid-range and leaning slightly bearish. However, the MACD histogram has turned positive, indicating decelerating bearish momentum, while the EMA200 at $315.65 confirms the structural bull trend remains intact."}},{"@type":"Question","name":"What are the key resistance levels GOOGL must break for a bullish reversal?","acceptedAnswer":{"@type":"Answer","text":"GOOGL must reclaim the EMA20 ($360.44) and EMA50 ($359.46) on the daily timeframe. A daily close above $362.00 (daily R1) would represent a meaningful technical shift. On the hourly chart, the EMA200 at $363.66 forms a heavier structural resistance ceiling. The $359–$362 zone is the critical near-term cluster to watch."}},{"@type":"Question","name":"How do Alphabet's fundamentals support the stock's outlook?","acceptedAnswer":{"@type":"Answer","text":"Alphabet reported revenue of $109.90 billion, up 21.8% year over year, with cloud growing 63%. CEO Sundar Pichai cited AI investments and the full-stack approach as driving performance. External fund managers, including ClearBridge Investments and Lakehouse Capital, have highlighted Alphabet's strong earnings and cloud performance in recent commentary."}}]}
Disclaimer: The content of this article solely reflects the author's opinion and does not represent the platform in any capacity. This article is not intended to serve as a reference for making investment decisions.
You may also like
Why former Bank of America strategist sees an Ethereum ‘tactical bottom’
SWIFT Just Named 30+ Ripple (XRP) Connected Banks. Here’s why
Solana News: Santiment Flags Record Bearish Sentiment, Analyst Eyes $127
3 Altcoins That Could Reach All-Time Highs This Weekend, July 11-12
Crypto prices
More


