Academician in the Crypto Circle: After Ethereum (ETH) broke through key support on 10.31, I actually saw an opportunity everyone else ignored
A quick word at the start: Honestly, the recent market really isn't suitable for heavy positions. The price can't rally and the drops aren't painful—it's just grinding along, with both longs and shorts frequently getting liquidated. I know those with itchy hands always want to trade and feel uncomfortable after even a day without a trade. But think about it: if you make ten trades back and forth, do you even make enough profit to cover the loss from a single stop out? When it comes to trading, less is more, and patience is the most important thing. Spend quality time with your family this weekend, stop staring at the candlestick charts all the time. The market is here every day, but your health is only one. Let's continue our discussion tomorrow!
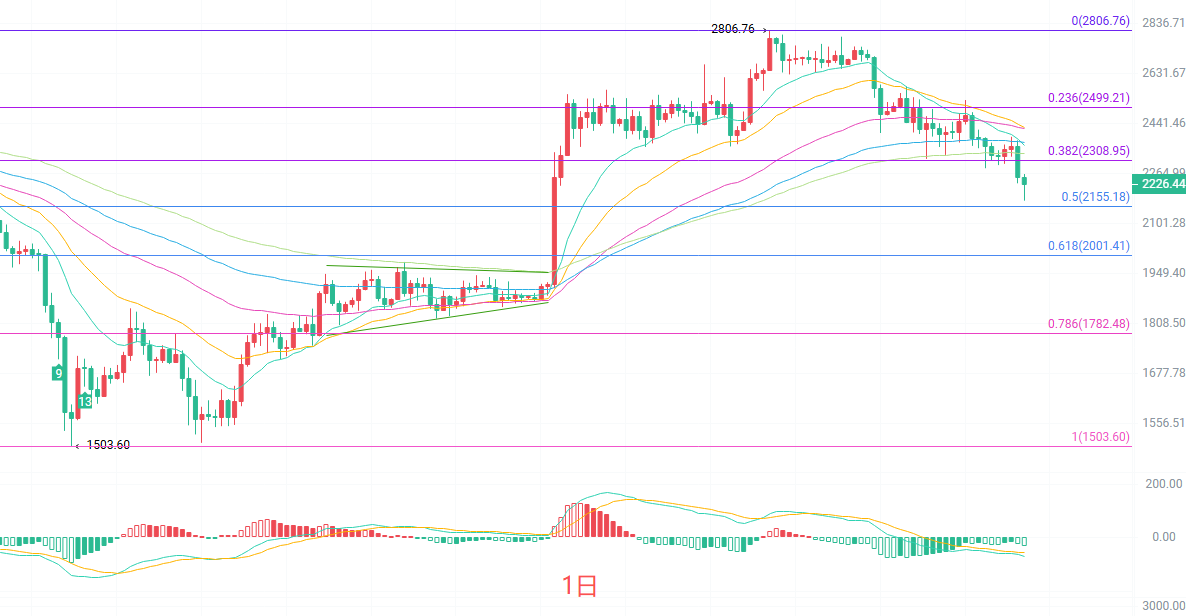
On the daily K-line, all moving averages are in a full bearish arrangement. The EMA15 is at 2364 and the EMA30 at 2425, with the price having significantly diverged from the short-term MAs. The MACD green bars are still expanding, indicating that downward momentum has not yet been exhausted. The Bollinger Bands are opening downward, with the middle band at 2393 now a strong resistance level. The lower band at 2247 has also been broken today, putting ETH in an oversold area, but oversold does not mean an immediate rebound, so don't be too quick to catch a falling knife.
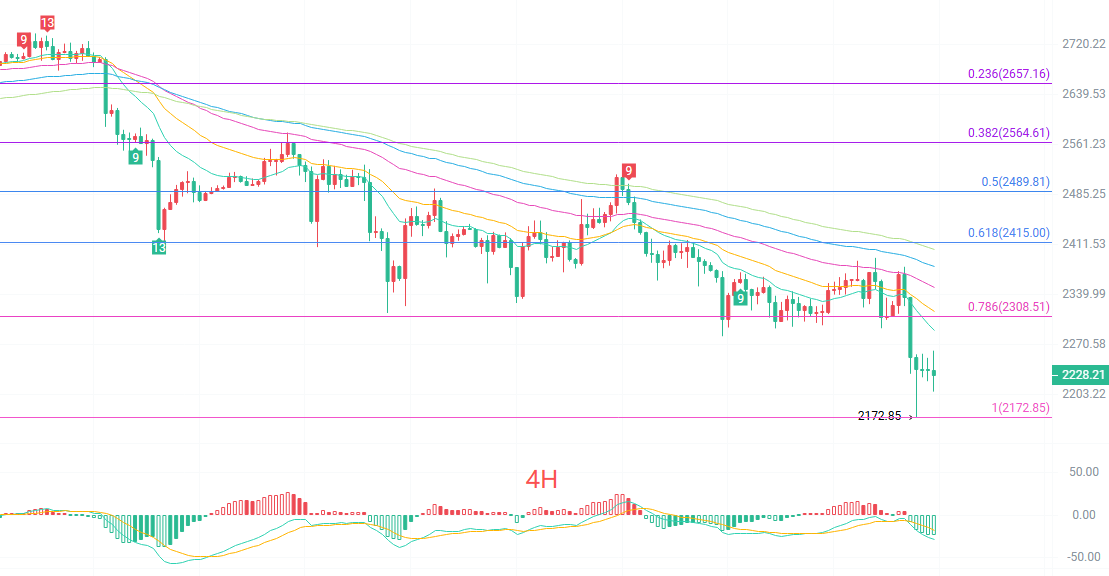
On the four-hour K-line, the TD Sequential has reached 5, which means the fifth candlestick in the downtrend has appeared. Watch for a low 9 signal that could trigger a short-term rebound. For moving averages, EMA15 is at 2289 and EMA30 at 2315. The price is running below all moving averages, which is a typical weak pattern. The MACD is positive but clearly turning downward, with red bars continuously shrinking, indicating bull strength is fading. The lower Bollinger Band at 2219 is a key short-term support. If this level breaks, the price will have more room to drop.
Short-term reference:
Go long if 2200 to 2150 holds as support; stop loss at 30 points, target 2250 to 2300.
Go short if 2300 to 2350 stalls; stop loss at 30 points, target 2250 to 2200.
Specific trading should be based on real-time order book data. For more updates, you can consult the author. As there is a delay in article publication, use this as reference only and bear your own risk.