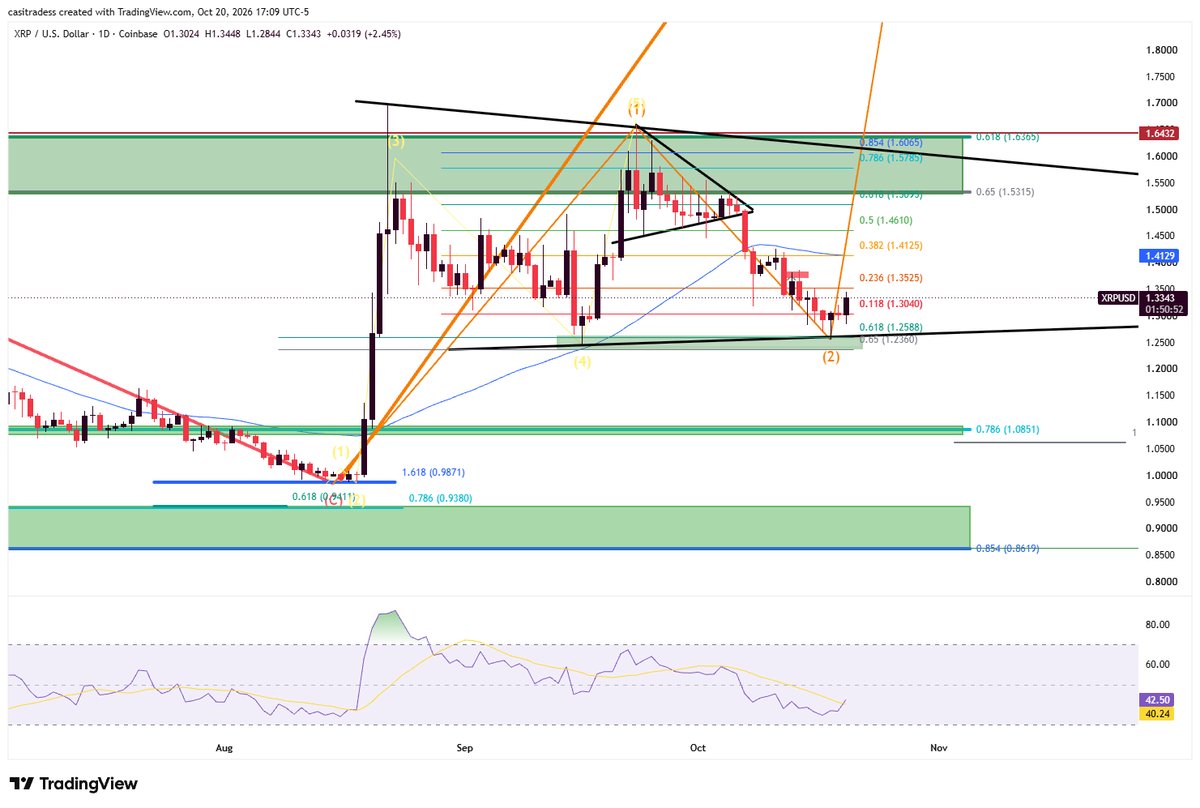
The analysis comes as $XRP trades around $1.33 on the daily chart, following a decline from its recent peak near $1.65 in September. The chart shows the token struggling below a descending trendline, with the recent price action leaving the market at a critical point.
$XRP Holds $1.27 Support
Casi Trades previously highlighted $XRP’s reaction at $1.27, noting that the level aligned with a local 0.618 Fibonacci retracement and her Wave 2 target under Elliott Wave Theory.
According to the analyst, $XRP’s ability to hold that level was an encouraging initial sign that a bottom is forming. The token subsequently rebounded toward the $1.30 area, which she identified as the first local Fibonacci resistance.
The accompanying chart places the 0.118 Fibonacci retracement near $1.3040, with $XRP recently trading around $1.3343.
The Relative Strength Index (RSI) stands near 42.50, below the neutral 50 mark but above its recent lows. This suggests that bearish pressure has eased somewhat without confirming a bullish trend reversal.
Casi cautioned that bottoming is a process, not a single price event. $XRP could revisit the $1.27 support area several times before establishing a sustained recovery.
The chart also shows converging trendlines around $XRP’s recent price action, with the token falling below the earlier consolidation structure. The $1.27 area remains a level to watch as traders assess whether buyers can prevent another decline.
 $XRP
Price 1-Day Chart with Elliott Wave Structures.
$XRP Break Above $1.65 Could Open Path to $2.40
Casi Trades identified $1.65 as the critical resistance level $XRP must overcome to confirm that its Wave 2 correction has ended.
In her Elliott Wave outlook, a successful break above this level would target $2.40 as part of a smaller Wave 3 advance. She views that move as confirmation that $XRP is transitioning into a larger bullish phase, with new all-time highs as the target.
The chart identifies additional Fibonacci levels between the current price and the $1.65 threshold. These include approximately $1.35, $1.41, $1.46, $1.53, and $1.58, which could present hurdles during a recovery.
In other words, $XRP must first reclaim these intermediate levels before challenging the key resistance zone. Even a move to $1.65 would not satisfy the analyst’s confirmation criteria if the price fails to break above it.
$XRP Risks $1.10 or $0.87 if Support Fails
Despite the potential for a bullish reversal, Casi Trades warned that $XRP’s downside targets remain in play if its previous low fails. She identified $1.10 as the next downside level, with $0.87 representing a deeper bearish target.
The chart also highlights a support region around $1.08 to $1.10 and a lower demand zone extending toward $0.87. Essentially, these areas would become relevant if $XRP loses the $1.27 level and selling pressure intensifies.


 thecryptobasic.com