
A chart visualizing commodity support and resistance: gold, silver, oil, gas, platinum, palladium, copper, agricultural futures (October 6, 2026)

Huitong Network, October 6 — One chart for commodities support and resistance: gold, silver, oil, gas + platinum, palladium, copper + agricultural futures, updated at 12:00 (UTC+8), Tuesday, October 6, 2026, covering 14 products including gold, silver, platinum, palladium, copper + crude oil, natural gas, fuel oil + wheat, corn, and cotton. For more details, see the special chart in Huitong Finance Xiruo.
One chart for commodities support and resistance: gold, silver, oil, gas + platinum, palladium, copper + agricultural futures, updated at 12:00 (UTC+8), Tuesday, October 6, 2026, covering 14 products including gold, silver, platinum, palladium, copper + crude oil, natural gas, fuel oil + wheat, corn, and cotton. For more details, see the special chart in Huitong Finance Xiruo.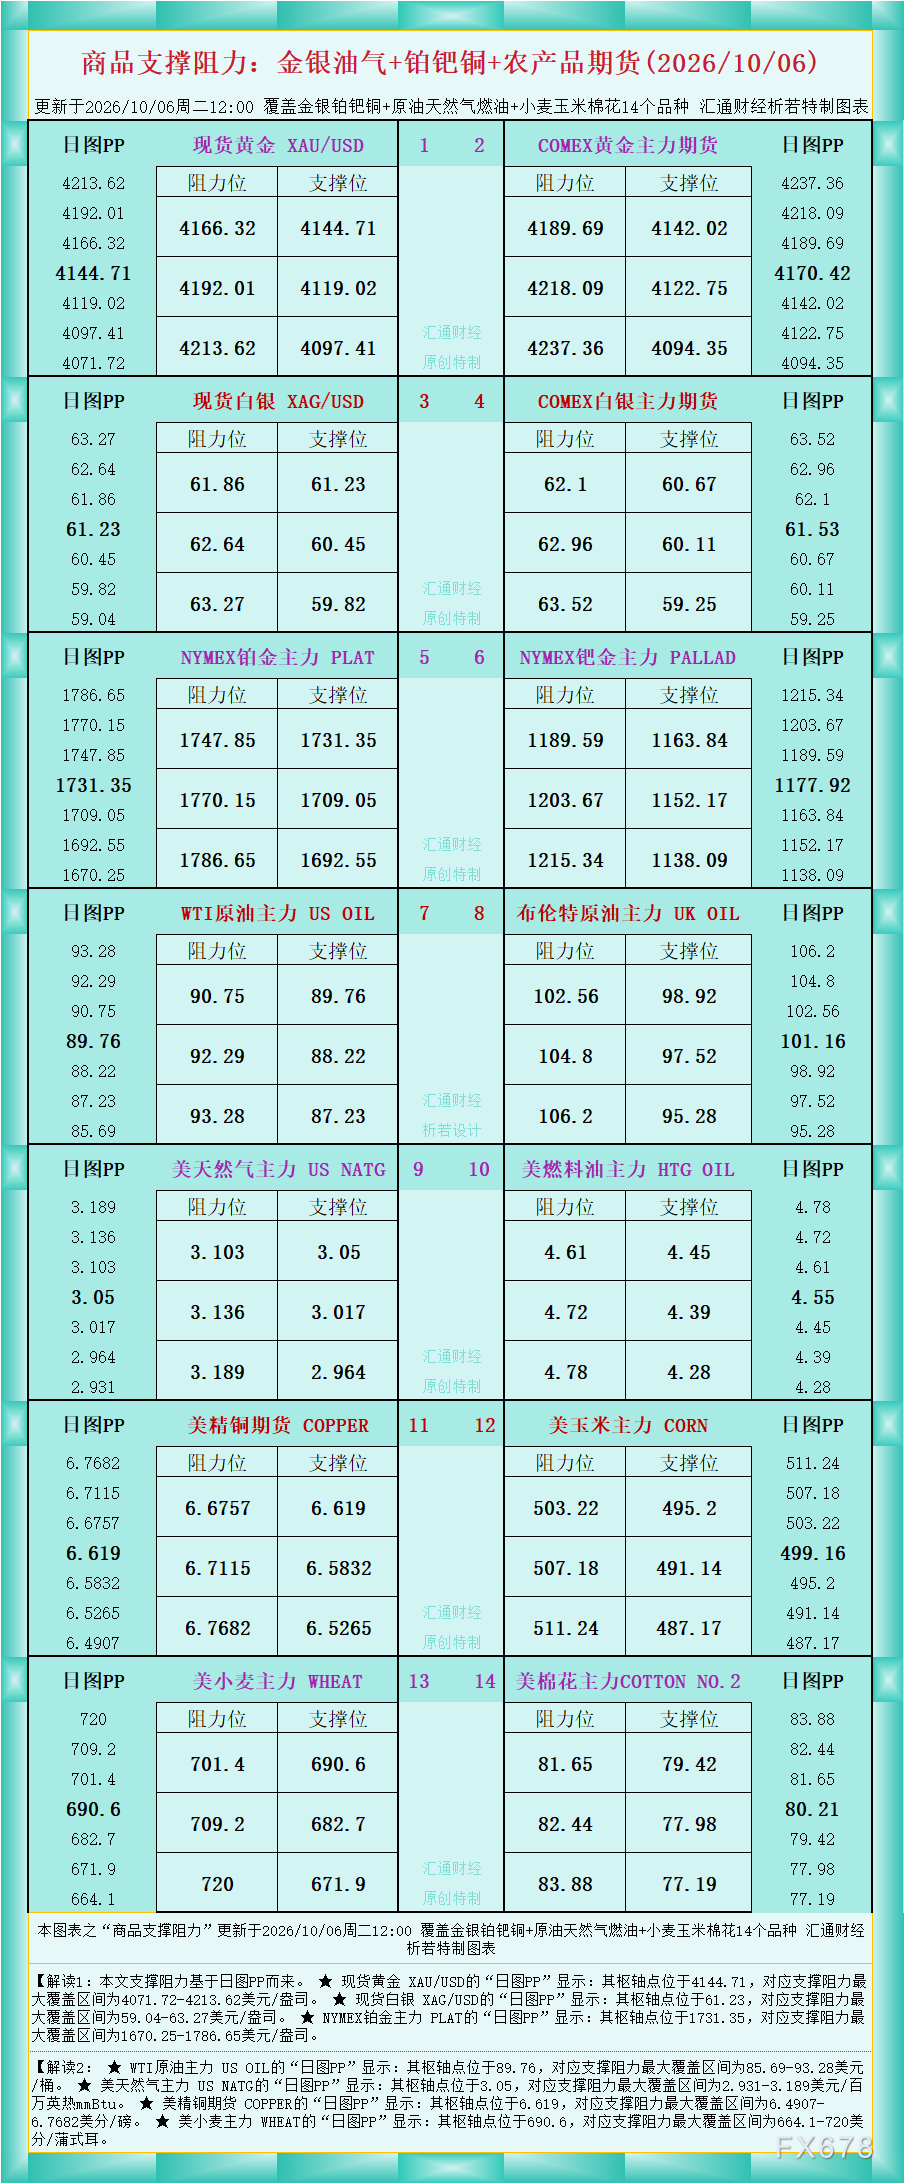
According to the data shown in the chart, Interpretation 1: The support and resistance levels in this article are based on daily PP charts.
★ Spot gold XAU/USD “daily PP” shows: the pivot point is at 4144.71, with the maximum support and resistance range at $4,071.72–4,213.62/oz.
★ Spot silver XAG/USD “daily PP” shows: the pivot point is at 61.23, with the maximum support and resistance range at $59.04–63.27/oz.
★ NYMEX platinum main contract PLAT “daily PP” shows: the pivot point is at 1,731.35, with the maximum support and resistance range at $1,670.25–1,786.65/oz.
Interpretation 2:
★ WTI crude oil main contract US OIL “daily PP” shows: the pivot point is at 89.76, with the maximum support and resistance range at $85.69–93.28/barrel.
★ US natural gas main contract US NATG “daily PP” shows: the pivot point is at 3.05, with the maximum support and resistance range at $2.931–3.189/million British thermal units (mmBtu).
★ US copper futures COPPER “daily PP” shows: the pivot point is at 6.619, with the maximum support and resistance range at 6.4907–6.7682 cents/pound.
★ US wheat main contract WHEAT “daily PP” shows: the pivot point is at 690.6, with the maximum support and resistance range at 664.1–720 cents/bushel.
For more product analysis, please refer to the chart.
Disclaimer: The content of this article solely reflects the author's opinion and does not represent the platform in any capacity. This article is not intended to serve as a reference for making investment decisions.
You may also like
Could the New SpaceX Debt Trigger Ray Dalio's AI Bubble Burst Warning?
AI Corporate Lending Shrinks Dramatically, Down $90 Billion in Three Months

Oil Prices Keep Rising Despite Plenty of Supply. JPMorgan Explains Why

Crypto prices
More


