
UniQure N.V. stock craters 37% to $24.54 as RSI signals capitulation

uniQure N.V. stock collapsed 37.25% on Tuesday, trading at $24.54 after a violent single-session repricing. Nearly every technical indicator now sits in extreme territory. The move demands a fresh read on trend, momentum, and potential inflection points.
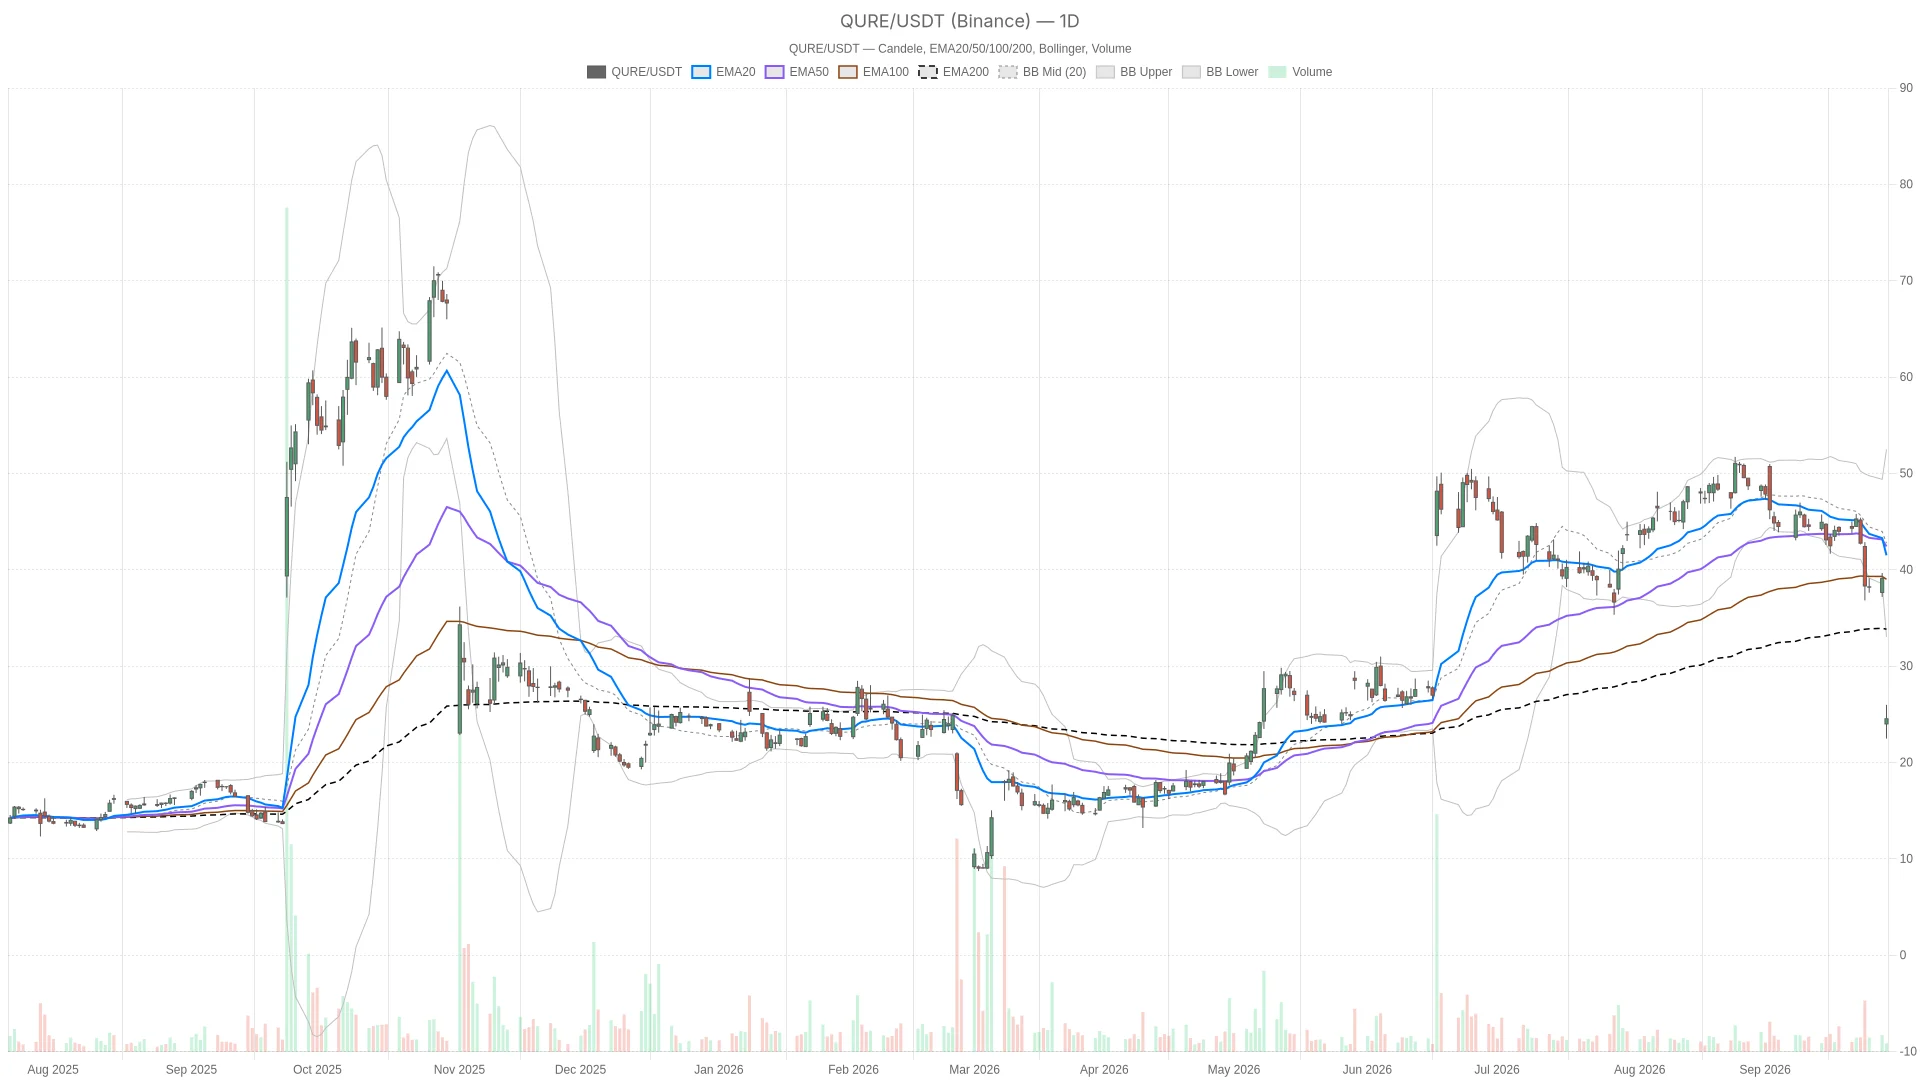 QURE — daily chart with candlesticks, EMA20/EMA50 and volume.
Summary
- Key takeaways
- uniQure N.V. Stock Daily Chart Shows a Structural Breakdown
- Hourly Momentum Confirms the Bearish Pressure
- Short-Term Chart Shows Early Signs of Stabilization
- Bullish Scenario: What a Recovery Would Require
- Bearish Scenario: Downside Risks Remain in Focus
- Positioning Into Elevated Volatility
- FAQ
Key takeaways
- uniQure N.V. stock plummeted 37.25% to $24.54 on September 29, 2026, in a single-session collapse.
- Daily RSI collapsed to 17.56, deep in oversold territory rarely seen outside capitulation events.
- Price trades below all major moving averages across daily, hourly, and 15-minute timeframes.
- Daily MACD histogram at -1.65 continues to widen, confirming selling pressure is still accelerating.
- Price is trading well below the daily Bollinger lower band of $33.04, an extreme dislocation.
uniQure N.V. Stock Daily Chart Shows a Structural Breakdown
The daily chart reveals a structural breakdown. The stock has gapped decisively below every major moving average in a single session. The EMA20 sits at 41.5 and the EMA50 at 42.42. Even the long-term EMA200 at 35.19 is now well above the current $24.54 print. That alignment tells a simple story: support that had held for months was shattered in hours.
Notably, the system’s regime reading still tags the daily trend as neutral. This is a reminder that trend-following measures lag sharply after a shock move of this magnitude. The price action itself, however, is unambiguous.
Momentum confirms the severity of the move. The daily RSI14 has collapsed to 17.56, deep into oversold territory rarely seen outside of capitulation events. Meanwhile, MACD on the daily chart reads -2.82 with a signal line at -1.18. The resulting histogram of -1.65 continues to widen. Selling pressure is still accelerating rather than fading.
Volatility Context and Pivot Levels
Volatility tells the same story. The daily Bollinger Bands have a midline of 42.76, an upper band of 52.49, and a lower band of 33.04. Price at 24.54 is trading well below the lower band itself. This rare dislocation typically signals either a violent trend acceleration or the early stages of a mean-reversion bounce. The ATR14 of 3.28 confirms that daily ranges have expanded sharply.
Pivot levels for the session sit at a pivot point of 24.34. Resistance stands at 26.18 and support at 22.69. This places the current price right at the pivot with limited room before testing either boundary.
Hourly Momentum Confirms the Bearish Pressure
Hourly momentum reinforces the bearish case. All moving averages are stacked above price and RSI sits deep in oversold territory. The one-hour chart regime reading is explicitly bearish. EMA20 at 33.19, EMA50 at 37.81, and EMA200 at 42.96 are all stacked above the current price. This is a textbook bearish alignment.
RSI14 at 22.35 remains deeply oversold. MACD shows a line of -4.13 against a signal of -2.72. The resulting histogram of -1.4 still leans negative. Meanwhile, Bollinger Bands on the hourly frame have a lower band at 22.56. Price is trading near but not fully outside that boundary, unlike the more extreme daily picture.
Therefore, the daily and hourly timeframes are aligned on direction. This is a bearish structure with momentum still tilted lower. The hourly pivot point sits at 24.47, with resistance at 25.02 and support at 24.15. Price is oscillating in a tight band just above the pivot. The market appears to be pausing to digest the drop rather than resolving it cleanly.
Short-Term Chart Shows Early Signs of Stabilization
The 15-minute chart offers the first hint of stabilization. A subtle bullish MACD crossover is forming inside an otherwise bearish structure. RSI14 has recovered to 32.08, still weak but no longer at extreme lows. The MACD line sits at -2.46 against a signal of -2.94, producing a positive histogram of 0.48. This subtle bullish crossover typically points to short-term exhaustion of selling rather than a full reversal.
However, the broader trend context on this timeframe remains bearish. EMA20 at 26.19, EMA50 at 30.64, and EMA200 at 37.86 all sit above the current price. The regime tag confirms bearish conditions. Bollinger Bands here are far tighter, with a midline of 24.23, an upper band of 25.32, and a lower band of 23.14. Price at 24.54 is trading inside these bands, near the midline. This is consistent with the intraday pause suggested by the MACD histogram.
For now, the 15-minute pivot point of 24.62, with resistance at 24.70 and support at 24.46, frames a very narrow trading range.
Bullish Scenario: What a Recovery Would Require
A bullish recovery would require price to reclaim hourly pivot resistance near 25.02. It would then need to push through daily resistance at 26.18. The bullish case rests almost entirely on mean reversion. RSI readings of 17.56 on the daily and 22.35 on the hourly chart are extreme. A relief bounce is therefore a reasonable technical possibility, regardless of the underlying trend.
For that scenario to gain traction, price would also need to sustain a move back above the 15-minute EMA20 at 26.19. This would help confirm that buyers are stepping in with conviction rather than simply covering shorts. Until then, any move higher should be treated as a bounce inside a broken structure. It is not evidence of a trend reversal.
Bearish Scenario: Downside Risks Remain in Focus
The bearish scenario remains the dominant outlook. MACD histograms are still negative and price sits below every major moving average. The weight of evidence favors continuation. MACD histograms remain negative on both the daily and hourly charts. Price is trading below every major moving average across all three timeframes.
In this context, if daily support at 22.69 gives way, the next reference points sit further below the current Bollinger lower band of 33.04. That area already looks stretched relative to the current $24.54 print. A failure to hold hourly support at 24.15 would also be significant. Paired with renewed downside acceleration in the MACD histogram, it would invalidate the bullish bounce thesis and point toward further downside pressure.
Positioning Into Elevated Volatility
uniQure N.V. stock sits at a genuine inflection point after losing more than a third of its value in a single session. The daily and hourly timeframes agree on a bearish structural backdrop. In contrast, the 15-minute chart shows only tentative, early-stage stabilization.
However, oversold momentum readings across every timeframe leave room for a sharp, sentiment-driven bounce. Such a bounce would not by itself repair the broken technical structure. With ATR readings elevated and price outside the daily Bollinger Bands, volatility should remain the defining feature of trading ahead. With the session still open, any positioning decision must account for further outsized swings in either direction.
FAQ
Why did uniQure N.V. stock drop 37% on September 29, 2026?
The article does not identify a specific catalyst for the drop. What is certain is that the move represents a violent single-session repricing that pushed nearly every technical indicator into extreme territory. The stock closed the previous session at $39.11 and was trading at $24.54 as of 14:18 ET on Tuesday.
Is uniQure N.V. stock oversold after the 37% crash?
Yes, across every timeframe. The daily RSI has collapsed to 17.56 and the hourly RSI sits at 22.35, both deep in oversold territory. However, the daily MACD histogram continues to widen at -1.65, suggesting selling pressure is still accelerating despite extreme RSI readings.
Where are the key support levels for uniQure N.V. stock?
Key support sits at $22.69 on the daily timeframe and $24.15 on the hourly chart. Below that, the daily Bollinger lower band at $33.04 has already been breached, leaving few established reference points at current levels.
Article produced with the assistance of artificial intelligence and reviewed by the editorial team.
Disclaimer: The content of this article solely reflects the author's opinion and does not represent the platform in any capacity. This article is not intended to serve as a reference for making investment decisions.
You may also like
Federal Reserve officials intensively release hawkish signals! The "third-in-command" says there may be another rate hike this year; Goolsbee warns that inflation persistently above target is "playing with fire"
Several Federal Reserve officials have commented on the outlook for inflation and interest rates.
Crypto Aave Gains 11% from a Planned Burn

OpenAI Challenges Meta: Launches Personal AI Assistant Dots, Premium Subscription at $500 per Month—Five Times the Price of Muse’s Top Tier
To compete with Meta's Muse for market share, OpenAI has launched its "always-on" AI agent, Dots. Dots runs on the GPT-6 Astra model and can proactively handle tasks such as research, programming, and document drafting for users. On the same day, OpenAI also released the GPT-6.1 Sol model, whose performance is close to Astra’s, but with standard token pricing at only one-fifth of Astra's. Meta's stock price briefly dropped after the release of Dots, then rebounded, ultimately closing up 3.24%.
Quantum-Si Incorporated stock surges 23% as RSI hits overbought at 74.7
Crypto prices
More


