
Invesco NASDAQ 100 ETF Stock Nears $307.57 Resistance as Bullish Trend Holds

The Invesco NASDAQ 100 ETF stock (QQQM) closed at $306.54 on September 25, up 0.46%, pressing against the upper edge of its recent range. The daily trend remains firmly bullish, though shorter-term signals suggest the rally is pausing at resistance.
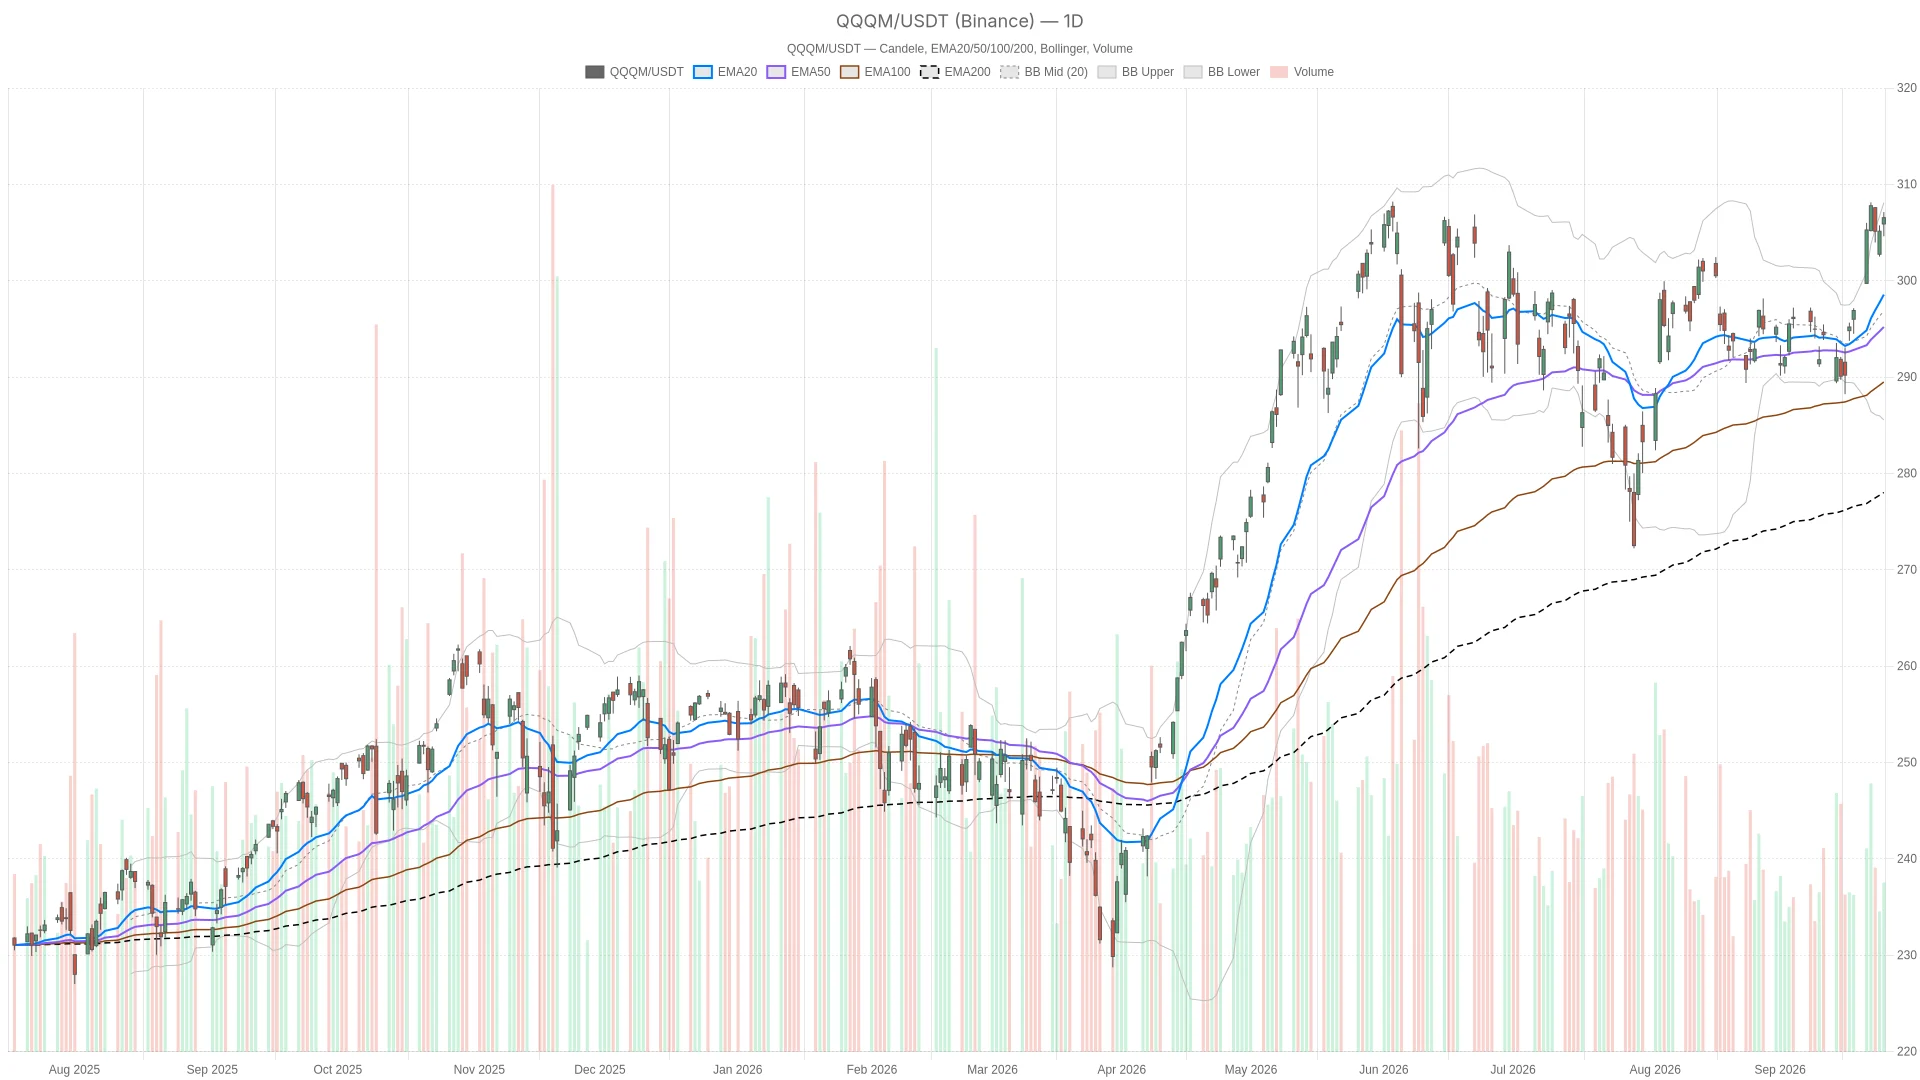 QQQM — daily chart with candlesticks, EMA20/EMA50 and volume.
Summary
Key takeaways
- QQQM closed at $306.54 on September 25, sitting above its 20-day EMA at $298.56, 50-day EMA at $295.20, and 200-day EMA at $278.02.
- The daily RSI14 reads 64.66, leaving room for further upside before momentum reaches overbought extremes.
- Daily MACD stands at 3.07, well above its signal line at 1.65, confirming expanding bullish momentum.
- Key resistance sits at $307.57 (R1), with the Bollinger upper band near $308.09 forming a critical confluence zone.
- The hourly MACD has turned slightly negative, signaling short-term momentum fatigue within an otherwise intact daily uptrend.
QQQM Daily Trend Remains Firmly Bullish
QQQM’s daily structure is unambiguously bullish. Price trades above all three key EMAs in textbook alignment, while expanding MACD momentum confirms the advance is part of a sustained move higher.
On the daily timeframe, price sits above the 20-day EMA at $298.56, the 50-day EMA at $295.20, and the 200-day EMA at $278.02. That stacked alignment signals the move higher is not a short-lived bounce. The daily RSI14 reads 64.66, firmly on the bullish side of neutral without tipping into overbought extremes. In practice, this leaves room for further upside before momentum becomes stretched.
The MACD on the daily chart reinforces that read. It sits at 3.07, well above the signal line at 1.65, with a positive histogram of 1.42. Momentum is not just bullish; it is expanding. Meanwhile, the Bollinger Bands show price at 306.54 against an upper band of $308.09 and a midline of 296.82. QQQM is hugging the top of its volatility envelope. This typically reflects trend strength. However, it also raises the odds of a short-term pause once that band is tested directly.
Daily Pivot Levels Define the Immediate Battlefield
The daily pivot at $306.09 and R1 at $307.57 frame the immediate trading range. A decisive break above R1 is required to confirm the next leg higher in the Invesco NASDAQ 100 ETF stock.
Friday’s close landed just above the pivot, effectively pinning price between the pivot and R1. A clean break through $307.57 would align with the Bollinger upper band near $308.09. That confluence makes it a meaningful line in the sand for continuation buyers. Meanwhile, the daily ATR14 of 3.89 confirms volatility remains moderate, consistent with a steady grind higher rather than a chaotic breakout.
Bullish Scenario for Invesco NASDAQ 100 ETF Stock
The bullish case rests on the daily trend continuing to dominate. If QQQM clears daily R1 at $307.57 and pushes through the Bollinger upper band near $308.09 on rising volume, buyers would confirm control. That opens the door to fresh highs. A daily RSI holding above 60 without spiking into overbought territory would support continuation. Likewise, the hourly MACD flipping back positive would realign short-term and daily momentum signals.
Corrective Risks If Support Levels Fail
Conversely, the corrective scenario requires confirmation from broken support. A daily close below the S1 pivot at $305.06, or a decisive loss of the 20-day EMA at $298.56, would invalidate the near-term bullish setup. In that case, the 50-day EMA at $295.20 becomes the next downside reference. A deteriorating daily MACD histogram would add weight to that shift.
Notably, recent Seeking Alpha commentary flagged that the Nasdaq Composite’s 16.5% year-to-date surge to all-time highs “masks mounting systemic risks.” That cautionary counterpoint is worth keeping in mind, even while the technical trend remains constructive.
Intraday Charts Flash Early Signs of Fatigue
The hourly trend structure remains bullish, yet momentum indicators are cooling. The Invesco NASDAQ 100 ETF stock is consolidating near its pivot rather than breaking out.
Turning to the 1-hour chart, the trend backdrop still supports the daily bullish bias. The EMA20 at 305.35, EMA50 at 302.62, and EMA200 at 296.50 remain properly stacked. The regime reading stays bullish. However, momentum on this shorter timeframe is cooling. The hourly MACD line at 1.03 has slipped below its signal line at 1.11, producing a negative histogram of -0.08. This divergence from the daily picture is subtle but notable: the bigger trend is intact, yet the intraday engine has lost thrust.
The hourly RSI14 at 62.17 still favors buyers, though it has pulled back from more extended readings. This hints at consolidation rather than reversal. The hourly Bollinger Bands show price at 306.52 against an upper band of 307.25 and a midline of 305.22. Combined with an hourly pivot at 306.53 — essentially matching the last close — the ETF is pausing at a decision point rather than committing higher.
On the 15-minute chart, short-term equilibrium prevails. Price at 306.52 sits just under the EMA20 of 306.35 but comfortably above the EMA50 at 305.76 and EMA200 at 302.14. The micro-trend remains technically bullish. However, the RSI14 has cooled to 54.85, a neutral reading. The MACD histogram is slightly negative at -0.09, with the MACD line at 0.29 below its signal at 0.37. Execution-focused traders should treat this as consolidation, not weakness, unless the 15-minute pivot support at 306.33 gives way.
QQQM in a Broader Nasdaq Context
QQQM continues to feature in broader Nasdaq-100 positioning debates. Cost, structure, and risk considerations complement the technical outlook for the Invesco NASDAQ 100 ETF stock.
It is worth noting that QQQM draws comparisons with rival Nasdaq-100 products. Recent Seeking Alpha coverage has weighed alternatives like IQQ and QQQE against QQQ and QQQM on fee and structural grounds. These positioning debates extend beyond pure price action into cost and portfolio-construction considerations.
Overall, the daily trend in QQQM remains bullish. It is anchored by a clean EMA stack, expanding MACD momentum, and an RSI with room before overbought. The hourly chart confirms the broader structure but shows early signs of fatigue. Price sits pinned near its pivot, and the 15-minute chart reflects short-term consolidation rather than a directional push. Given the proximity to the upper Bollinger Band and daily resistance at $307.57, volatility around this zone warrants close attention. Positioning decisions should account for the possibility of a pause or shallow pullback within an otherwise intact uptrend.
FAQ
What is the near-term resistance level for QQQM?
The immediate resistance for the Invesco NASDAQ 100 ETF stock sits at $307.57 (daily R1), with the Bollinger upper band near $308.09 forming a key confluence zone that buyers must clear to confirm the next leg higher.
Is the daily trend in QQQM still bullish?
Yes. The daily structure remains firmly bullish. Price sits above the 20-day, 50-day, and 200-day EMAs, the MACD is expanding positively, and the RSI at 64.66 has room before reaching overbought levels.
What support levels should traders watch?
Key support sits at the daily S1 pivot of $305.06. Below that, the 20-day EMA at $298.56 and the 50-day EMA at $295.20 represent structurally important downside levels that would need to break for a trend shift to take hold.
Article produced with the assistance of artificial intelligence and reviewed by the editorial team.
Disclaimer: The content of this article solely reflects the author's opinion and does not represent the platform in any capacity. This article is not intended to serve as a reference for making investment decisions.
You may also like
XRP Eyes Higher Levels If It Repeats Last Weekend Run
Cyber Hornet launches Nasdaq ETF with 25% XRP, 75% S&P 500 exposure
AI Agents Opt for Ripple USD Not XRP, While BlackRock Makes Stunning New Prediction
U.S. economy defies 5% bond yields as consumer spending and business activity surge
Crypto prices
More


