The call is built on a weekly chart that leans heavily on pattern repetition. FET has spent much of the past cycle grinding lower under a descending trend-line.
On Mikybull’s map, that lid is now being tested again, and the structure looks a lot like the setups that preceded earlier expansion phases.
A pattern the chart has printed before
The weekly view highlights previous periods where FET compressed under downward-sloping resistance, then broke and ran. Those earlier legs are marked as major upside expansions — the kind of moves that turned prolonged drawdowns into multi-month rallies.
Mikybull’s argument is that the current structure is rhyming with those phases. Price is sitting near the same kind of descending resistance that capped prior bases. The implication is straightforward: if this lid gives way with conviction, the next expansion could be underway.
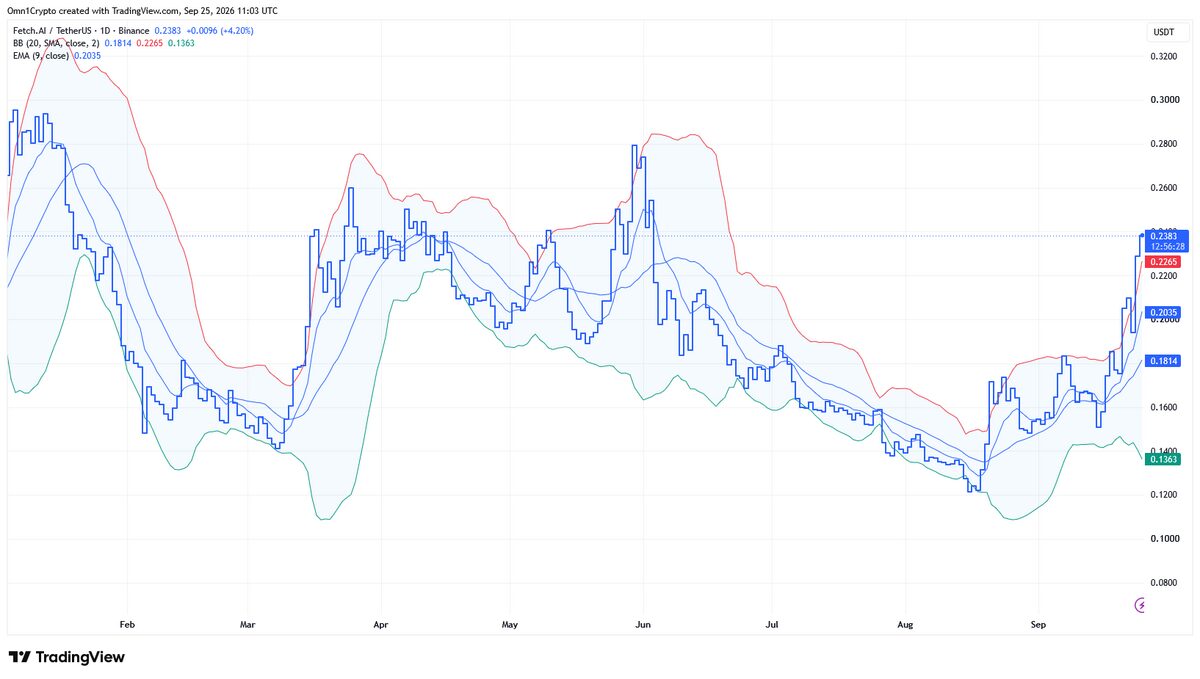
At the time of the post, FET was trading around the $0.23 area, still far below prior cycle highs and a long way from the $9 objective. That gap is exactly why the target is ambitious. From current levels, $9 would represent a full-cycle recovery move, not a modest bounce.
Why $9 is the figure being floated..
The $9 bull target is not framed as next week’s price. It is a macro objective tied to the size of previous breakout legs on the weekly chart. Mikybull had previewed the idea a day earlier, saying another “banger chart” would corroborate the FET setup and “silence the doubters.”
The published chart does that job visually: past breakouts, marked expansion zones, and a projected upside area that stretches into high single digits. In that framing, the current reclaim attempt is the opening act, not the entire thesis.
What FET price still has to prove
A descending trendline test is not the same thing as a confirmed breakout. FET still needs to clear and hold above the resistance that has defined the downtrend. Without that, the setup remains a compelling parallel rather than a completed reversal.
Momentum context matters too. The weekly oscillator on the chart shows room to rebuild after a long period of softer readings, but follow-through will depend on whether buyers can turn the trendline break into sustained acceptance higher.
Mikybull’s case is clear: FET is pressing a familiar weekly resistance zone, prior breaks from similar structures led to large rallies, and the bullish measured objective on his map sits near $9.
That makes the near-term level more important than the headline target. If FET can break the descending lid and hold it, the broader bull-run narrative gains traction.