
Advanced Micro Devices Stock Faces Crossroads as Data Center Revenue Jumps 50%

Advanced Micro Devices stock is trading at a pivotal juncture. The daily chart shows consolidation between exhaustion and renewal, while shorter timeframes reveal a more decisive push higher. That tension between a neutral daily structure and firmer intraday momentum is the core story right now.
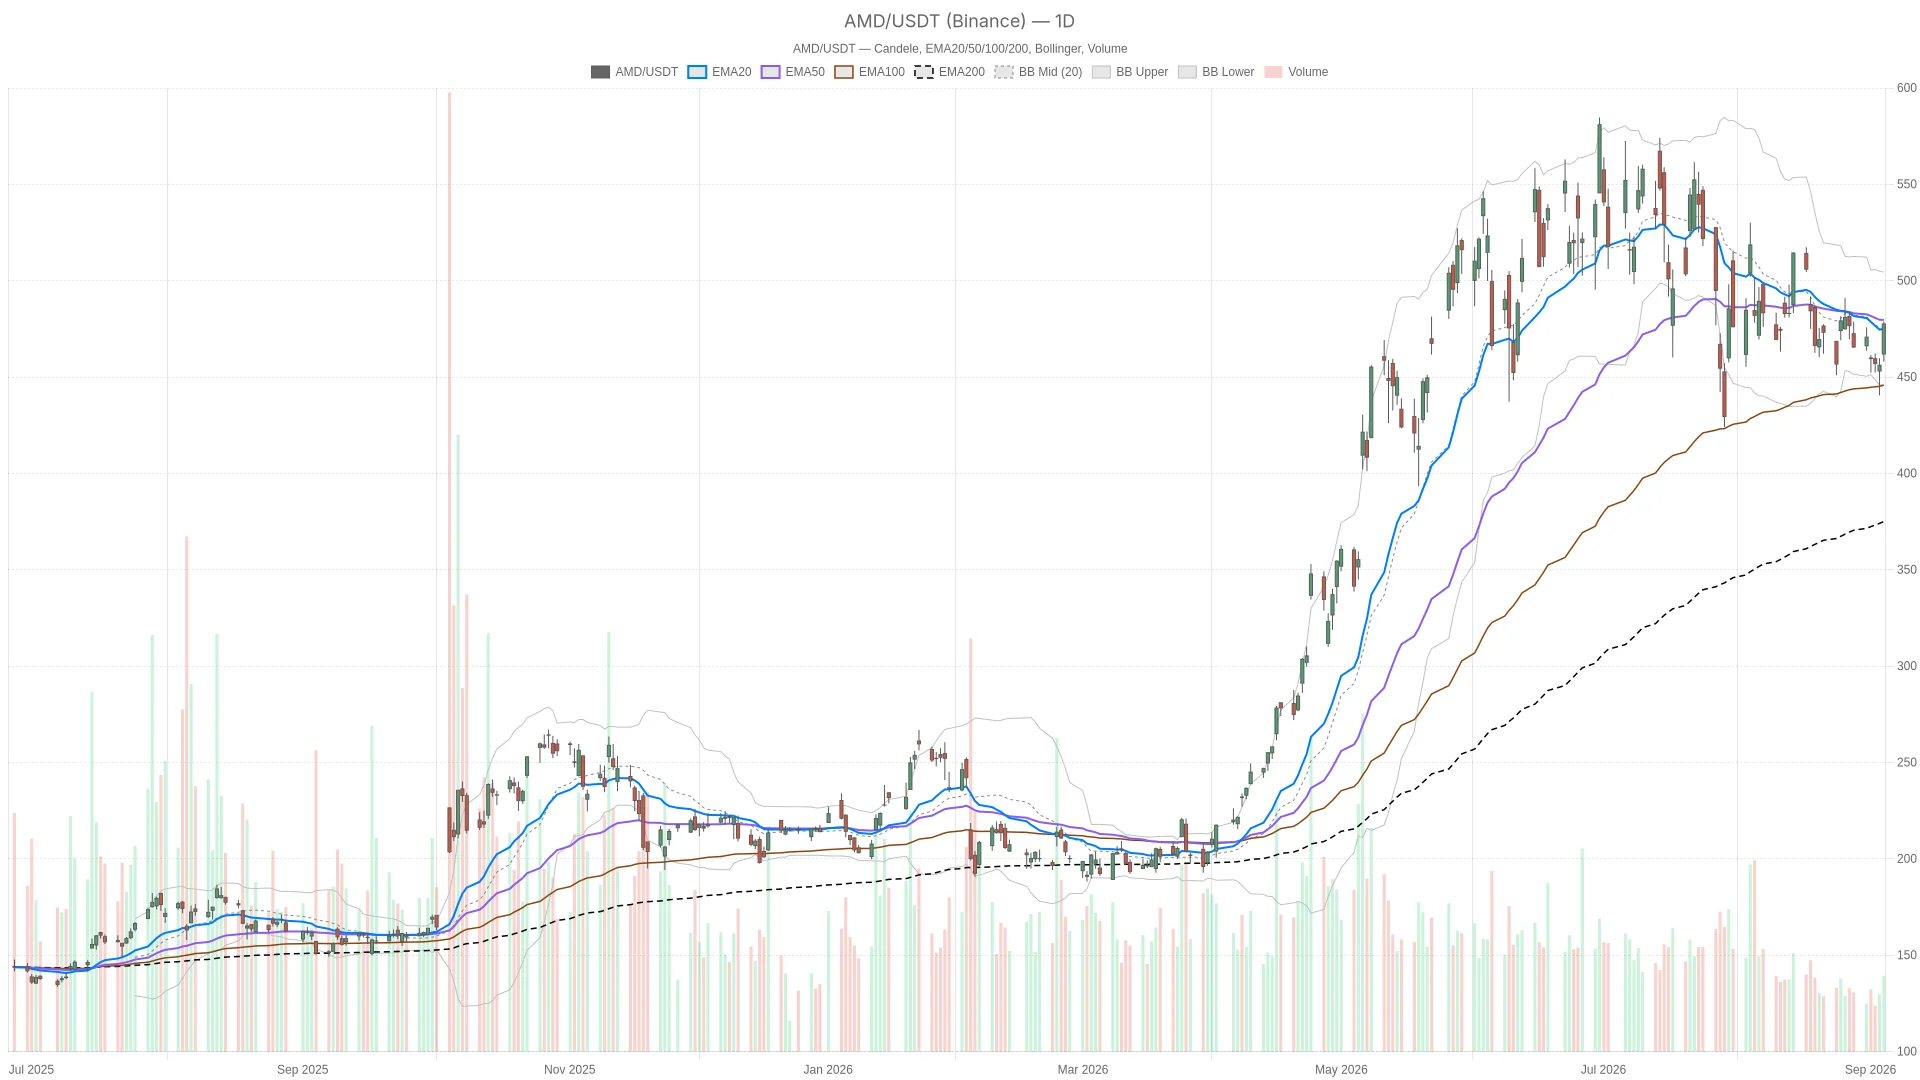 AMD — daily chart with candlesticks, EMA20/EMA50 and volume.
Summary
Key takeaways
- AMD closed at 477.57, positioned between its 20-day EMA at 474.91 and 50-day EMA at 479.66 on the daily chart.
- Hourly RSI14 at 68.7 and MACD histogram at 2.34 signal clear bullish momentum on the 1H timeframe.
- The 15-minute chart shows early exhaustion with MACD histogram turning negative at -0.31, despite a bullish EMA alignment.
- Data center revenue drove Q2 results with 50% year-over-year growth to $11.54 billion, potentially reaching 70% of total revenue by 2027.
- Analyst opinion is split between valuation concerns and bullish data center growth expectations.
Daily Picture: Advanced Micro Devices Stock in Neutral Consolidation
The daily chart for Advanced Micro Devices stock shows a market in consolidation with no clear directional bias. Price remains trapped between key moving averages, reflecting a pause in trend rather than a reversal.
AMD closed at 477.57 after printing a session high of 478.83. Price sits just above its 20-day EMA at 474.91, but below the 50-day EMA at 479.66. That positioning between two moving averages signals consolidation, not trend continuation. Meanwhile, the 200-day EMA rests far below at 375.1. This reminds traders the broader uptrend remains intact even as short-term action cools.
Momentum Indicators Show Early Stabilization
RSI14 on the daily timeframe reads 49.67 — essentially neutral. The market has no strong directional bias at this level. The MACD line at -8.21 remains below its signal line at -8.35. However, the histogram has turned marginally positive at 0.14. Momentum was fading on the downside. Now it shows the first sign of stabilizing. It is not yet a bullish confirmation, but it is a shift worth watching.
Bollinger Bands place the mid-line at 475.2, with the upper band at 504.46 and the lower at 445.94. Price closing near the mid-line reinforces a market in balance, with room to move in either direction. Daily ATR14 stands at 18.48, which is elevated. Even within this consolidation, day-to-day swings remain sizable. The daily pivot sits at 471.47, with resistance at R1 484.93 and support at S1 464.10. Overall, the daily regime is officially tagged neutral.
1H Timeframe: Momentum Firms Up
Advanced Micro Devices stock shows a more constructive picture on the hourly chart. Short-term EMAs have turned supportive, and momentum indicators point decisively higher.
AMD closed the latest hour at 477.45, comfortably above its 20-hour and 50-hour EMAs at 465.77 and 466.04. However, price remains just under the 200-hour EMA at 478.92. That level has capped the recent advance. The gap between short-term EMAs and the longer 200-hour average is where the real tension lies.
RSI14 on the 1H chart has climbed to 68.7, approaching overbought territory. At the same time, the MACD line at 2.96 sits well above its signal line at 0.63. The histogram reads 2.34. That is a clear bullish momentum signal on this timeframe. It stands in contrast to the more subdued daily picture. The 1H Bollinger upper band sits at 477.7. Price is essentially testing that ceiling right now. This suggests the current push is stretched in the near term.
1H ATR14 is 5.9, and hourly pivot levels show support at 472.79 and resistance at 480.47. The immediate battle is being fought in a tight band just above the pivot point at 475.81. If buyers can clear 480.47 with conviction, the 200-hour EMA resistance becomes less of an obstacle.
15m Execution Context
On the 15-minute chart, Advanced Micro Devices stock is explicitly in a bullish regime. Price structure supports that label with a clean EMA alignment across all periods.
AMD trades above all three EMAs — 20, 50 and 200 period — at 471.77, 467.09 and 465.16 respectively. That is a clean bullish alignment. Yet the MACD histogram has just turned negative at -0.31. The MACD line at 2.43 still sits above the zero line. This is an early sign that short-term momentum is cooling. Still, the broader 15m trend remains intact.
RSI14 on this timeframe reads 67.84, close to overbought. Price is trading above the upper Bollinger Band at 476.92. That combination — price above the band with momentum stalling — is typically a warning sign for short-term buyers. The 15m pivot sits at 476.61, with resistance at 479.67 and support at 474.39. For execution purposes, a pullback toward that pivot or the 474.39 support would offer a cleaner entry than chasing strength at current levels.
The Fundamental Backdrop
The fundamental narrative behind Advanced Micro Devices stock remains powerful despite the technical uncertainty. Record data center growth drives the bullish case, though valuation concerns create friction.
AMD posted record Q2 results, with revenue up 50% year-over-year to $11.54 billion. This was driven by data center strength. One prediction suggests data center revenue could pass 70% of AMD’s total revenue in 2027. That would happen even before the Helios ramp is finished. Notably, one segment doubled last quarter while everything else combined grew just 8%.
Market Rotation and Analyst Divide
On September 4, AMD gained 4.7% while Intel rose 4.5% and Nvidia added only 0.8%. That single session is consistent with investors widening the AI trade beyond Nvidia. However, it cannot confirm a lasting rotation on its own. Meanwhile, analyst opinion is genuinely split. One view argues AMD is more expensive than Nvidia and Broadcom. It calls this a medium-term sentiment and valuation peak, worthy of a Hold rating. Another take frames AMD as a Buy. The bullish case cites robust data center growth, AI partnerships, and management’s outlook.
Bullish Scenario
The bullish case for Advanced Micro Devices stock rests on hourly and 15-minute strength translating into a daily breakout. A close above the daily pivot at 471.47, followed by a push through daily R1 at 484.93, would confirm the neutral daily regime is resolving higher. Support from the 1H MACD histogram and the 15m EMA alignment would need to hold. Continued strength in the data center narrative from recent earnings also matters. If the AI trade broadening beyond Nvidia persists, AMD stands to benefit further given its revenue mix shift.
Bearish Scenario
The bearish case for Advanced Micro Devices stock centers on rejection at current levels. Overbought readings and upper-band tests across multiple timeframes leave little room for further advance without a pullback.
Price is already testing or exceeding upper Bollinger Bands on both the 1H at 477.7 and the 15m at 476.92. RSI readings near 68-69 on both those frames leave limited room for further advance without a pause. A failure to clear 1H R1 at 480.47, combined with the fading 15m MACD histogram, would point toward a pullback. A break below the daily EMA20 at 474.91 would weaken the setup. A drop below daily S1 at 464.10 would invalidate the near-term bullish case. Focus would then shift toward the lower Bollinger region near 445.94. Valuation concerns around AMD trading above Nvidia and Broadcom multiples add another layer of caution.
Closing Take on Advanced Micro Devices Stock
Advanced Micro Devices stock sits at a genuine crossroads between timeframes. The daily chart is neutral and consolidating. The hourly chart shows firm bullish momentum testing resistance. The 15-minute chart flashes early signs of short-term exhaustion within an otherwise bullish trend. Volatility remains elevated across all timeframes. The fundamental picture mirrors that technical uncertainty: strong data center growth against rising valuation concerns. Positioning here should account for both outcomes rather than assuming current momentum simply continues unchecked.
FAQ
Is Advanced Micro Devices stock bullish or bearish right now?
The daily chart for Advanced Micro Devices stock is officially neutral, with RSI14 at 49.67 and price caught between the 20-day EMA at 474.91 and the 50-day EMA at 479.66. However, shorter timeframes like the 1H chart show firm bullish momentum, with MACD histogram at 2.34 and RSI14 at 68.7. The overall picture is one of tension between timeframes, not a clear directional signal.
What are the key support and resistance levels for AMD?
On the daily timeframe, key support sits at S1 464.10 and the 20-day EMA at 474.91. Key resistance is at R1 484.93 and the 50-day EMA at 479.66. On the hourly chart, immediate resistance is at 480.47, with the 200-hour EMA at 478.92 also acting as a cap. Hourly support sits at 472.79.
What is driving Advanced Micro Devices stock fundamentally?
Data center growth is the primary driver. AMD posted record Q2 revenue of $11.54 billion, up 50% year-over-year. One prediction suggests data center revenue could exceed 70% of total revenue by 2027. However, valuation concerns exist, with some analysts arguing AMD now trades at a premium to Nvidia and Broadcom.
Is the AI trade rotating into AMD?
There are early signs of rotation. On September 4, AMD gained 4.7% while Nvidia added only 0.8%. This is consistent with investors broadening the AI trade beyond Nvidia. However, a single session cannot confirm a lasting rotation. The broader data center growth trend supports the case for AMD benefiting from AI demand.
{"@context":"https://schema.org","@type":"FAQPage","mainEntity":[{"@type":"Question","name":"Is Advanced Micro Devices stock bullish or bearish right now?","acceptedAnswer":{"@type":"Answer","text":"The daily chart for Advanced Micro Devices stock is officially neutral, with RSI14 at 49.67 and price caught between the 20-day EMA at 474.91 and the 50-day EMA at 479.66. However, shorter timeframes like the 1H chart show firm bullish momentum, with MACD histogram at 2.34 and RSI14 at 68.7. The overall picture is one of tension between timeframes, not a clear directional signal."}},{"@type":"Question","name":"What are the key support and resistance levels for AMD?","acceptedAnswer":{"@type":"Answer","text":"On the daily timeframe, key support sits at S1 464.10 and the 20-day EMA at 474.91. Key resistance is at R1 484.93 and the 50-day EMA at 479.66. On the hourly chart, immediate resistance is at 480.47, with the 200-hour EMA at 478.92 also acting as a cap. Hourly support sits at 472.79."}},{"@type":"Question","name":"What is driving Advanced Micro Devices stock fundamentally?","acceptedAnswer":{"@type":"Answer","text":"Data center growth is the primary driver. AMD posted record Q2 revenue of $11.54 billion, up 50% year-over-year. One prediction suggests data center revenue could exceed 70% of total revenue by 2027. However, valuation concerns exist, with some analysts arguing AMD now trades at a premium to Nvidia and Broadcom."}},{"@type":"Question","name":"Is the AI trade rotating into AMD?","acceptedAnswer":{"@type":"Answer","text":"There are early signs of rotation. On September 4, AMD gained 4.7% while Nvidia added only 0.8%. This is consistent with investors broadening the AI trade beyond Nvidia. However, a single session cannot confirm a lasting rotation. The broader data center growth trend supports the case for AMD benefiting from AI demand."}}]}
Article produced with the assistance of artificial intelligence and reviewed by the editorial team.
Disclaimer: The content of this article solely reflects the author's opinion and does not represent the platform in any capacity. This article is not intended to serve as a reference for making investment decisions.
You may also like
ETH bridge deposits on Robinhood Chain surge 150% to $700 million in September
Bitcoin News Today: BTC Holds $79K Ahead of Fed Risk While MemeToro Publishes New Contract Code
The United States Accelerates the "Next-Generation Computing Revolution"! GlobalFoundries (GFS.US) Secures $375 Million Quantum Computing Subsidy, New Quantum Forces Also Receive Funding
GlobalFoundries announced on Tuesday that it has finalized an agreement with the U.S. Department of Commerce CHIPS Act Research and Development Office to receive $375 million in R&D funding, aimed at accelerating the growth trajectory of its Quantum Technology Solutions (QTS) business.

3 Altcoins Ready for Ascent: ETH, KAS, NEAR
Crypto prices
More


