

 invezz.com
Arbitrum has gained nearly 30% over the past 24 hours as record activity on Robinhood Chain and a sharp increase in trading volume have pushed $ARB towards the $0.12 resistance level.
CoinGecko data puts $ARB near $0.11 at the time of writing, after the token climbed from roughly $0.085 and briefly traded close to $0.12.
The move left $ARB up more than 15% over the past seven days and roughly 45% over two weeks.
Robinhood Chain has emerged as the main catalyst behind $ARB's latest move.
The Ethereum layer 2, built using Arbitrum technology, processed a record 5.52 million transactions on Aug. 30, according to figures reported by Arbitrum, while decentralised exchange volume reached roughly $875 million.
At the same time, apps on Robinhood Chain generated roughly $2.66 million in revenue over 24 hours, trailing only Solana's $5.07 million and surpassing Ethereum and Base.
For Arbitrum, the increase in activity carries an economic link through the Arbitrum Expansion Program.
Robinhood Chain returns 10% of its net protocol revenue to the Arbitrum ecosystem, with 8% allocated to the ArbitrumDAO treasury and 2% to the Arbitrum Developer Guild, according to the Arbitrum Foundation.
More than 30 Arbitrum chains settling outside Arbitrum One operate under the same revenue model.
However, the $2.66 million recorded over 24 hours came from applications on Robinhood Chain, not the chain's protocol revenue, meaning the 10% share cannot be applied directly to that figure.
Memecoin trading has driven a large part of the recent activity. Users created roughly 22,600 tokens through Pons in a single day, while Pons, GMGN and Uniswap generated roughly 88% of all application revenue.
Pons and GMGN brought in close to $2 million between them, with Uniswap adding roughly $307,000.
The numbers put memecoins behind much of the latest increase in Robinhood Chain usage, even though the network launched with tokenised assets as one of its main use cases.
$ARB's price move has also been amplified in derivatives markets. Open interest has climbed to roughly $88 million as the token moved higher, while short liquidations and traders closing bearish positions added buying pressure during the breakout.
The result has been an unusually large move compared with the rest of the crypto market.
$ARB has gained close to 30% over 24 hours while Bitcoin remains near $78,000 and several other large-cap cryptocurrencies have posted much smaller gains.
However, the sharp rise comes less than a month before another increase in circulating supply.
A scheduled unlock on Sept. 23 will release 139.15 million $ARB, equal to 1.4% of total supply and roughly 2% of its current market capitalisation.
Insiders are allocated 53.8% of the unlocked tokens, private investors 35%, and the Arbitrum Foundation 11.2%.
$ARB would therefore need enough buying demand to absorb any tokens that reach the market, particularly if the price is still testing the $0.12 to $0.14 area by the time of the unlock.
$ARB price analysis
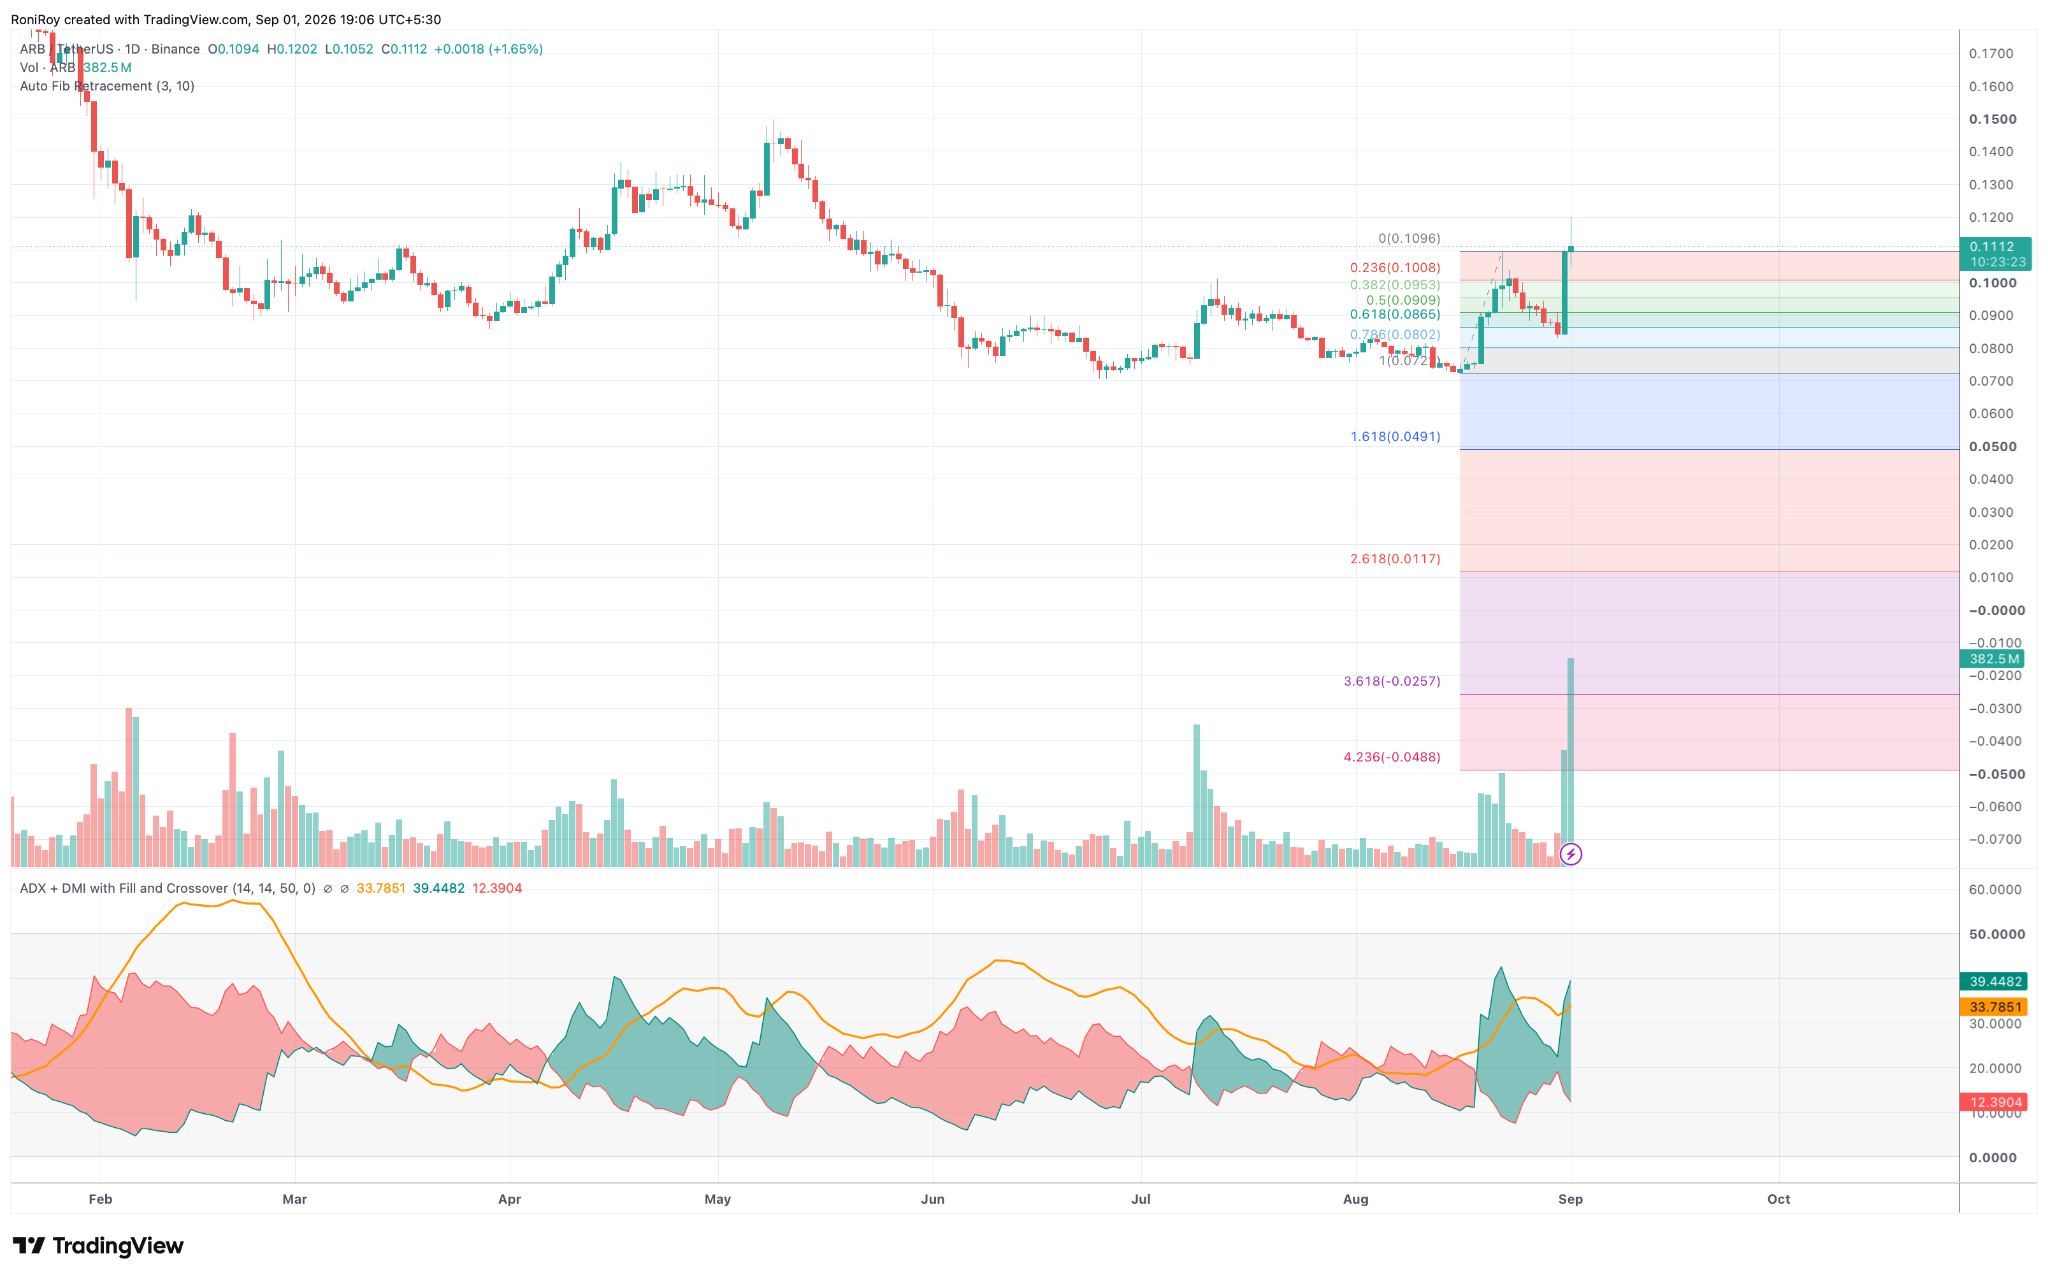
$ARB's daily chart has broken above the entire Fibonacci retracement range drawn from the August low near $0.072 to the previous swing high around $0.1096. See below.
$ARB/$USDT 1-day price chart. Source: TradingView.
Price reached roughly $0.12 during the latest move before returning to around $0.111.
The former Fibonacci levels now provide several areas where buyers could defend a pullback.
The 23.6% level sits at $0.1008, followed by the 38.2% retracement at $0.0953 and the 50% level at $0.0909.
If $ARB falls below $0.0909, the next support sits near the 61.8% Fibonacci level at $0.0865.
ADX on the daily chart stands near 33.8, above the 25 level commonly associated with a strong directional move.
The positive directional indicator, or +DI, has climbed to roughly 39.4, while -DI sits near 12.4.
With +DI more than three times -DI, buying pressure currently has a sizeable lead over selling pressure.
Holding above the previous $0.1096 swing high would keep $0.12 as the first upside level.
A daily close above $0.12 could clear the way for the $0.13 area, followed by $0.14, where $ARB last traded during its May decline.
The 4-hour chart shows how quickly the latest move has stretched price. See below.
$ARB/$USDT 4-hour price chart. Source: TradingView.
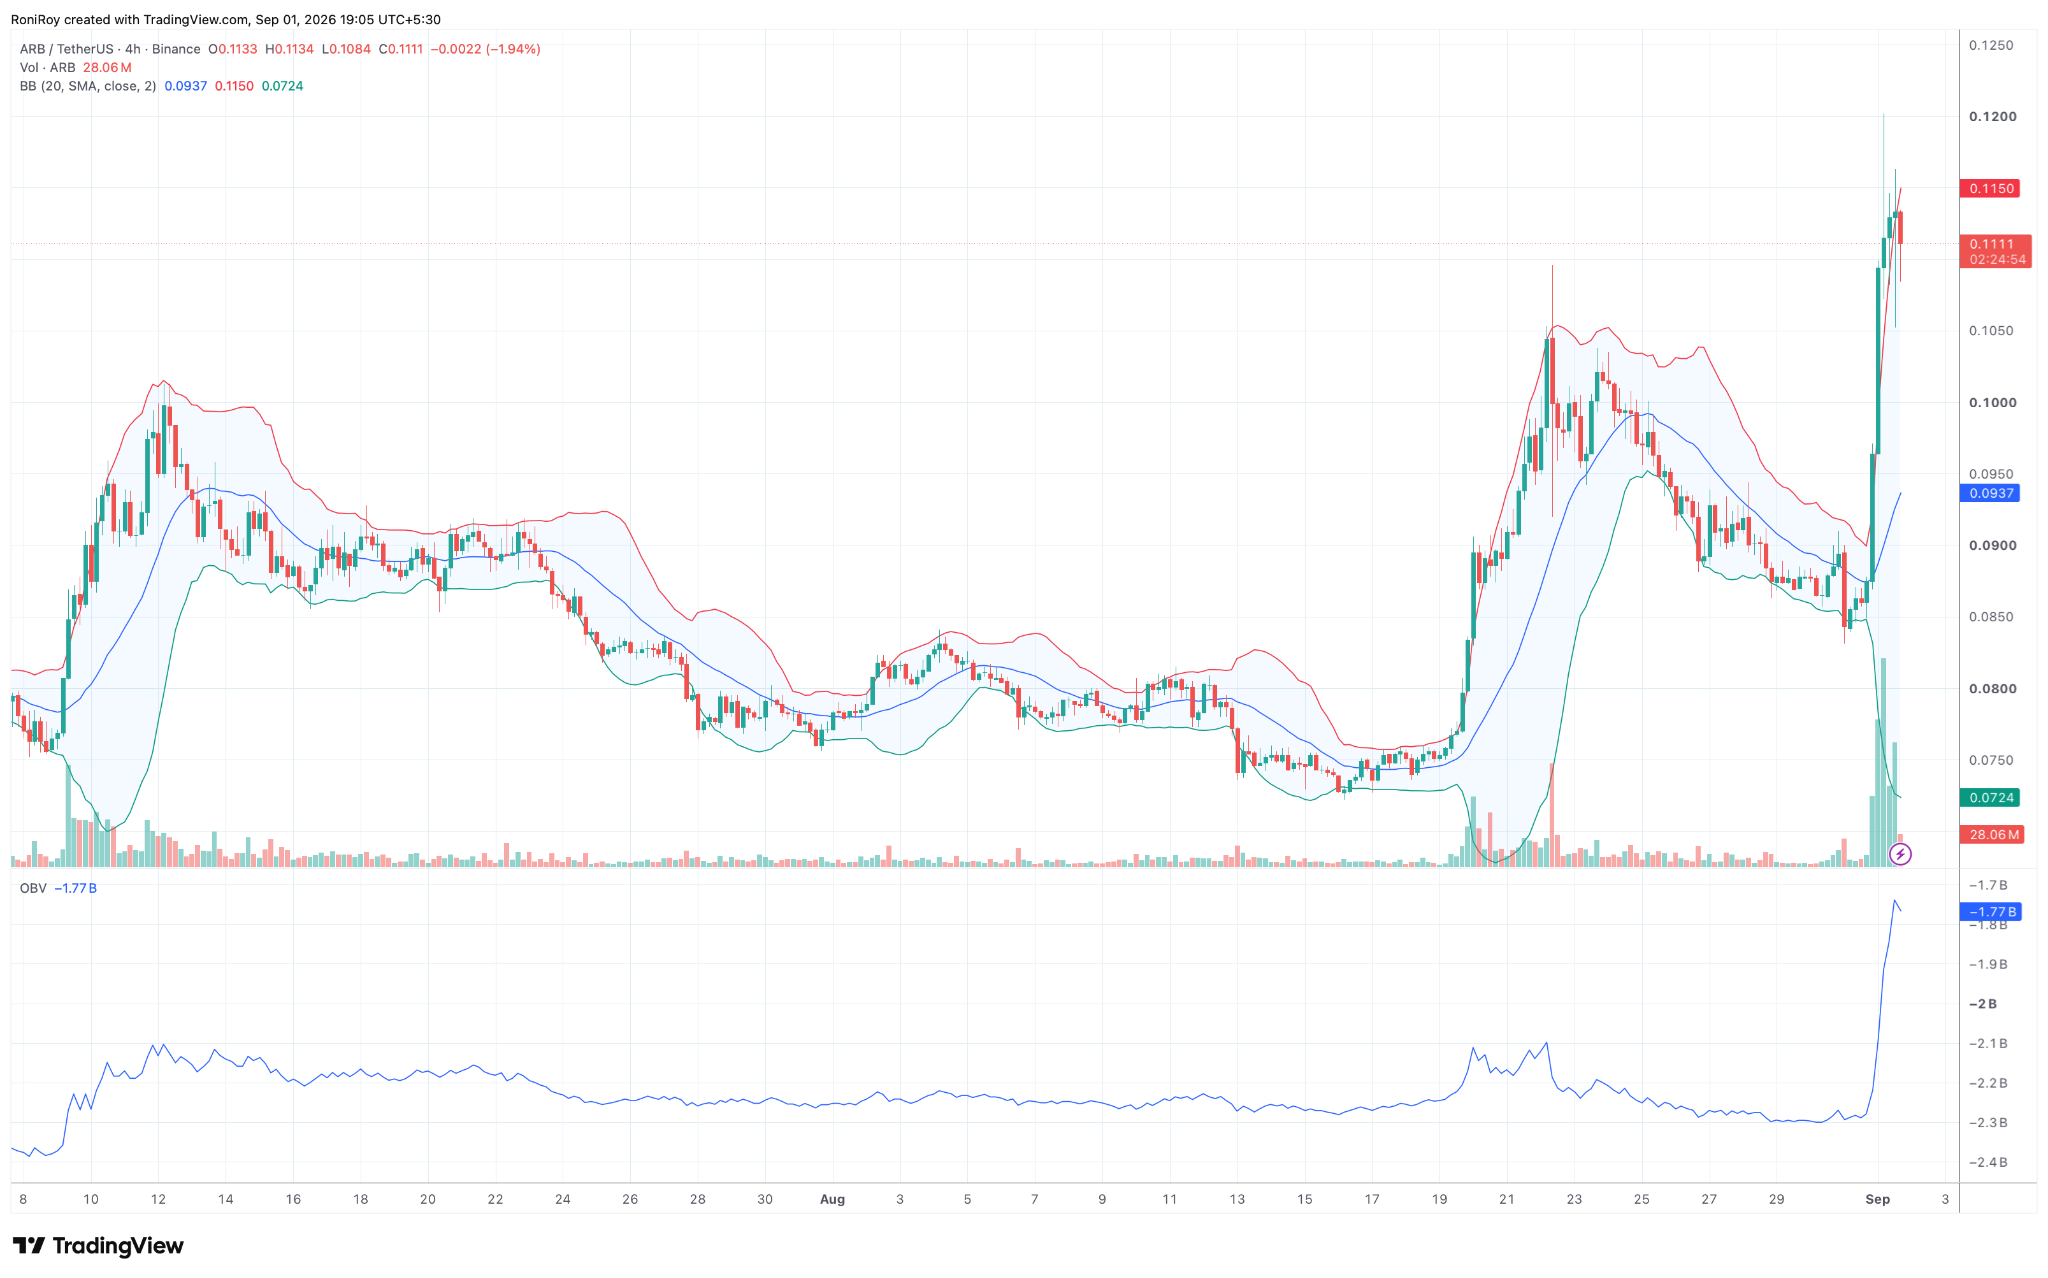
$ARB surged through the upper Bollinger Band and reached $0.12 before falling back to roughly $0.111.
The upper band is currently near $0.115, while the 20-period middle band remains much lower at roughly $0.0937.
Trading outside the upper band during the initial breakout confirmed the strength of the price move, but $ARB's return below $0.115 means the token would need to reclaim that level before making another attempt at $0.12.
Failure to hold $0.105 could expose $0.10, with the daily Fibonacci level at $0.1008 providing the next support.
4-hour on-balance volume has risen sharply from roughly -2.3 billion to -1.77 billion during the breakout.
The increase occurred alongside a large jump in trading volume and $ARB's move through $0.10, showing that buying volume expanded with price instead of weakening during the breakout.
A continued rise in OBV alongside a move back above $0.115 would support another test of $0.12.
Clearing $0.12 would put $0.13 and then $0.14 within reach, while a reversal in OBV accompanied by a loss of $0.1008 would increase the risk of a pullback towards $0.0953 and $0.0909.


