
A Chart of Commodity Support and Resistance: Gold, Silver, Oil, Gas + Platinum, Palladium, Copper, and Agricultural Futures (August 31, 2026)

Huitong Network, August 31— One chart to view commodities’ support and resistance: gold, silver, oil, gas + platinum, palladium, copper + agricultural futures, updated on Monday, August 31, 2026, at 10:20 (UTC+8), specifically covering 14 varieties including gold, silver, platinum, palladium, copper + crude oil, natural gas, fuel oil + wheat, corn, cotton. For more details, see the special chart in Huitong Finance by Xiruo.
One chart to view commodities’ support and resistance: gold, silver, oil, gas + platinum, palladium, copper + agricultural futures, updated on Monday, August 31, 2026, at 10:20 (UTC+8), specifically covering 14 varieties including gold, silver, platinum, palladium, copper + crude oil, natural gas, fuel oil + wheat, corn, cotton. For more details, see the special chart in Huitong Finance by Xiruo.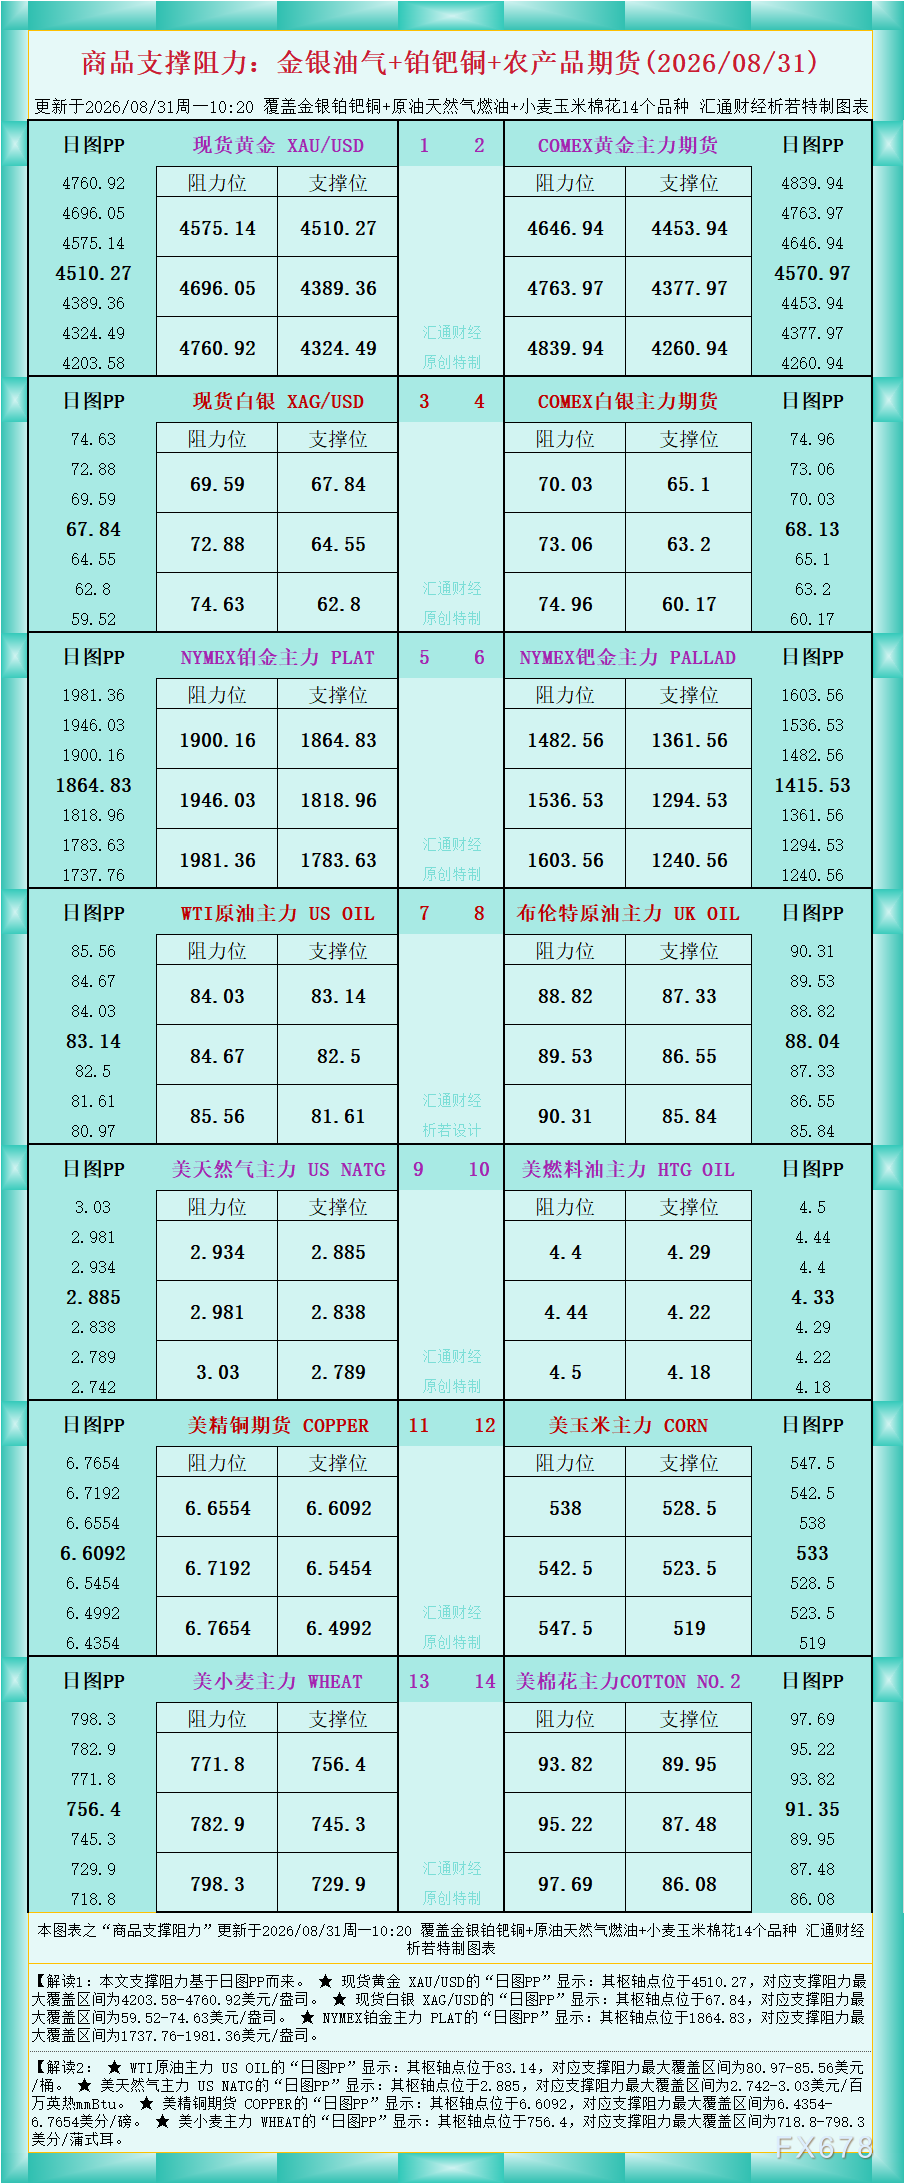
According to the data shown in the chart, Interpretation 1: The support and resistance levels in this article are based on daily PP.
★ The daily PP for spot gold XAU/USD shows: the pivot is at 4510.27, with the maximum support and resistance range at 4203.58–4760.92 USD/ounce.
★ The daily PP for spot silver XAG/USD shows: the pivot is at 67.84, with the maximum support and resistance range at 59.52–74.63 USD/ounce.
★ The daily PP for NYMEX platinum main contract PLAT shows: the pivot is at 1864.83, with the maximum support and resistance range at 1737.76–1981.36 USD/ounce.
Interpretation 2:
★ The daily PP for WTI crude oil main US OIL shows: the pivot is at 83.14, with the maximum support and resistance range at 80.97–85.56 USD/barrel.
★ The daily PP for US natural gas main US NATG shows: the pivot is at 2.885, with the maximum support and resistance range at 2.742–3.03 USD per million British thermal units (mmBtu).
★ The daily PP for US copper futures COPPER shows: the pivot is at 6.6092, with the maximum support and resistance range at 6.4354–6.7654 cents/pound.
★ The daily PP for US wheat main WHEAT shows: the pivot is at 756.4, with the maximum support and resistance range at 718.8–798.3 cents/bushel.
For more varieties, refer to the chart.
Disclaimer: The content of this article solely reflects the author's opinion and does not represent the platform in any capacity. This article is not intended to serve as a reference for making investment decisions.
You may also like
NZD/USD Price Forecast: Bulls defend trendline above 0.5900
Telegram’s Gram Wallet Push Puts Crypto in Reach of a Billion Users
Glacier Bancorp Chairman Craig A. Langel acquires 2,250 shares worth $105,840
Diana Shipping reports GNK common share sales worth $280,602.51
Crypto prices
More


