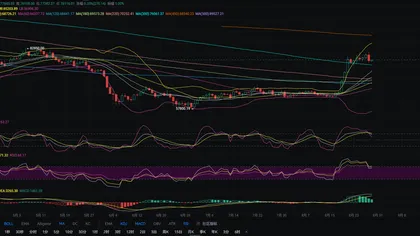
Crypto Academician: On August 30, Bitcoin (BTC) faced resistance and retreated after reaching new highs. Analyzing the logic behind token turnover in this round of price surge. Latest market analysis and operational advice
Bitcoin is currently priced at 77,800. After the surge, it has entered a tug-of-war phase. Many traders rushed in after seeing the price jump, only to face choppy trading that wore them down. After significant gains, avoid blindly expecting further rises or immediately reversing to bearish views; the market rarely moves unilaterally upward, and mid-cycle corrections are common. With Bitcoin at 77,800, divergence at the high levels is already apparent. The risks of chasing high prices are increasing, as many newcomers are easily swayed by short-term bullish momentum and overlook the impact of possible corrections.
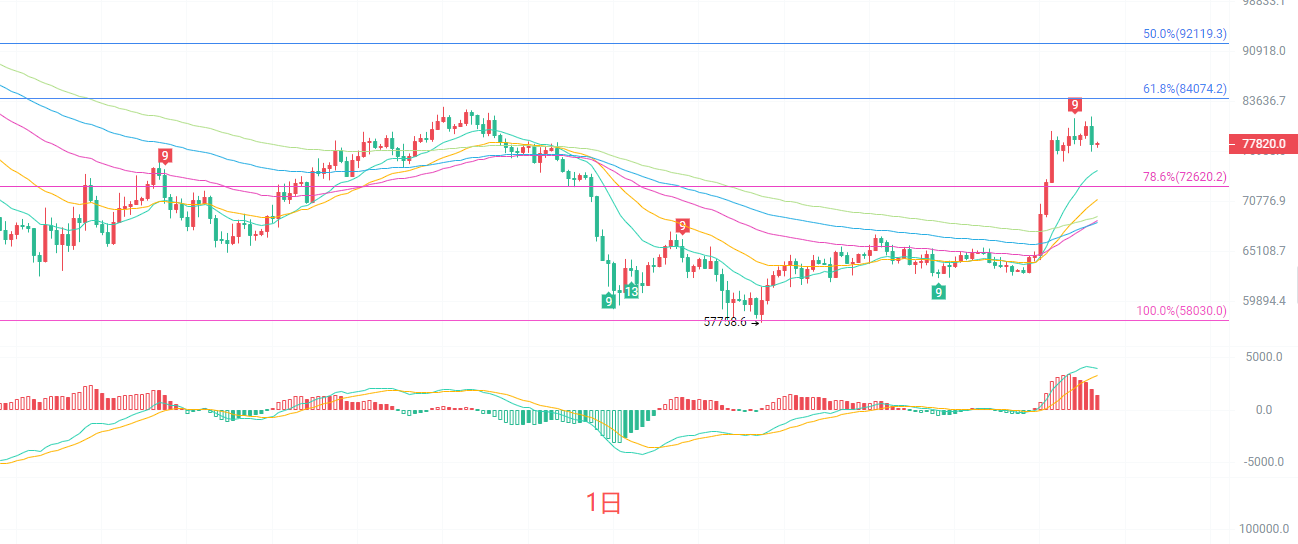
The daily K-line remains stable above all the medium and long-term EMA lines, with the large-scale bullish structure intact. The MACD indicator is turning downward at high levels, red bars are shrinking, and the upper Bollinger band is suppressing price, indicating that selling pressure is gradually being released. The Fibonacci 78.6% level at 73,890 is a key support below. On the daily chart, this phase is a high-level correction after a strong rise, not a straightforward reversal to bearish. Short-term resistance is at 81,500; breaking above this would restart the bullish momentum. If key support fails, the correction space for this surge will further open up. In the long cycle, focus on how well support holds.
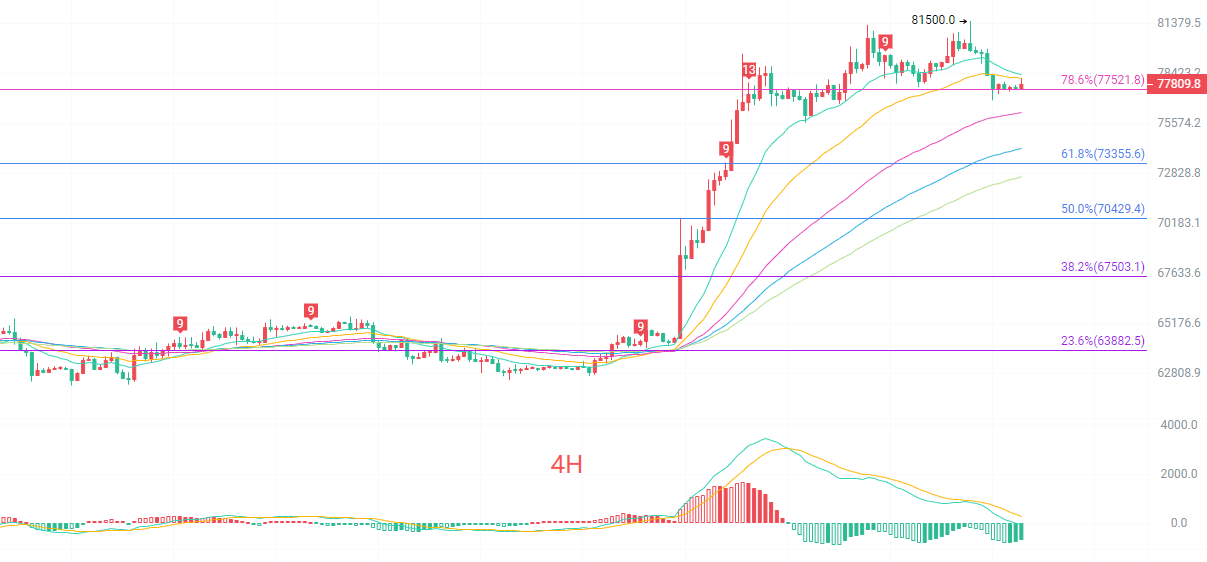
The four-hour K-line has already broken below the short-term EMA15 and EMA30 moving averages. The 4-hour MACD lines continue downward, with expanding green bars signaling a clear weakening of bullish momentum. The Bollinger band shows the price falling from the upper band to run near the mid-band, indicating the short-term market is entering an adjustment cycle. 77,521 is the key Fibonacci 78.6% level, and the price is currently contending around this point. For bulls to regain strength, the price needs to move above 79,500 again; if support breaks, the market will further probe the 73,355 level. This four-hour stage is a retracement after bullish movement, showing weak, choppy conditions in the short term. Avoid bottom-fishing; wait for clear confirmation signals.
Short-term reference:
Go north from 76,800 to 76,400, stop-loss at 76,000, target 79,500 to 81,200
Go south from 80,000 to 81,000, stop-loss at 81,500, target 79,000 to 78,000

Friendly reminder: The above content is original by the author and posted only on this official account. Any advertisements at the end of the article or in the comment section are unrelated to the author. Please stay vigilant and distinguish carefully. Thank you for reading.