

Key Insights
- SUI trading volume surged by 37%, signaling renewed participation as the price stabilizes near 0.97, reflecting a transition from prolonged downtrend conditions
- Futures inflows and bullish long-short ratios indicate rising speculative interest, while liquidation trends show slight upward pressure across major exchanges
- SUI must reclaim the 1.10 to 1.15 resistance range to confirm a structural shift, as mixed spot flows continue to reflect market uncertainty
Sui is showing signs of stabilization as trading activity rises sharply across major exchanges. Trading volume has increased by about 37%, indicating stronger market participation after a prolonged downturn. Besides, this surge reflects growing trader interest, even as price action remains relatively constrained in the short term.
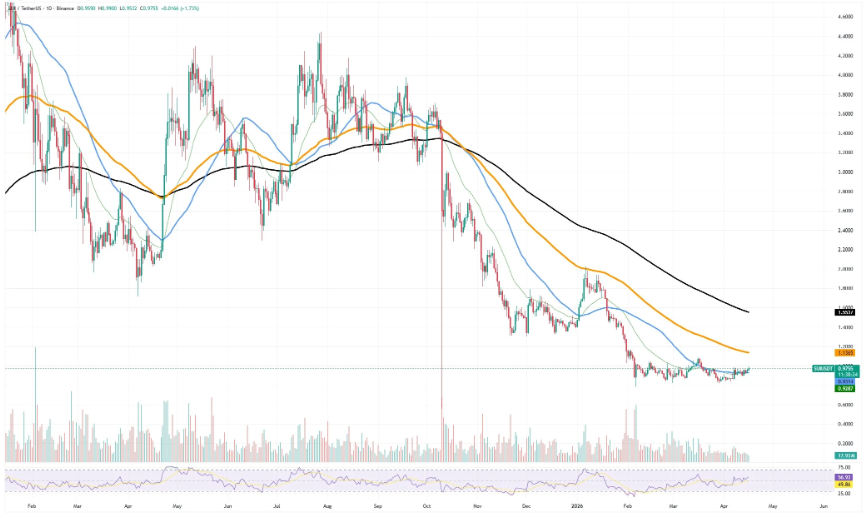
SUI is attempting to establish a support base around the $0.97 level after months of declining highs and lows. Price movement has slowed, and candles have tightened, which signals reduced volatility. Consequently, the market structure now reflects a late-stage downtrend transition rather than continued aggressive selling.
Momentum Weakens Despite Bearish Structure
The broader trend remains negative despite short-term stabilization in price action. Higher-time-frame moving averages continue to stay above the current price, reinforcing the existing bearish structure. However, flattening short-term averages suggests that downward momentum is losing strength.
 Source:
Futures market data shows notable inflows, including sharp spikes such as a 672% net increase over short periods. This trend suggests that speculative capital is returning to SUI markets. Moreover, derivatives positioning indicates growing activity, although it does not confirm a sustained directional move.
Long Short Ratio Indicates Bullish Bias
The long-to-short ratio remains between 1.9 and 2.2 across multiple exchanges, reflecting a bullish leaning among traders. Additionally, liquidation data shows a slight tilt toward short liquidations, which supports mild upward pressure. However, positioning alone does not determine long-term direction, as volatility often precedes clarity.
Spot market flows continue to show uncertainty despite short bursts of accumulation. While short-term inflows appear positive, longer intervals still reflect hesitation through intermittent outflows. Hence, this mixed behavior highlights a lack of strong conviction among participants.
Resistance Zone Holds Key to Trend Shift
SUI must reclaim the 1.10 to 1.15 range to confirm any meaningful structural shift. This zone aligns with key resistance levels and moving average confluence. Significantly, failure to break above this range keeps the broader bearish outlook intact despite improving short-term conditions.
SUI is no longer in a sharp decline, and liquidity conditions are improving alongside increased participation. Additionally, the formation of a base suggests that selling pressure is easing. However, sustained buying activity remains necessary to support any potential breakout scenario.


