
XRP Price Turns Soft, Red Signals Renewed Bearish Pressure

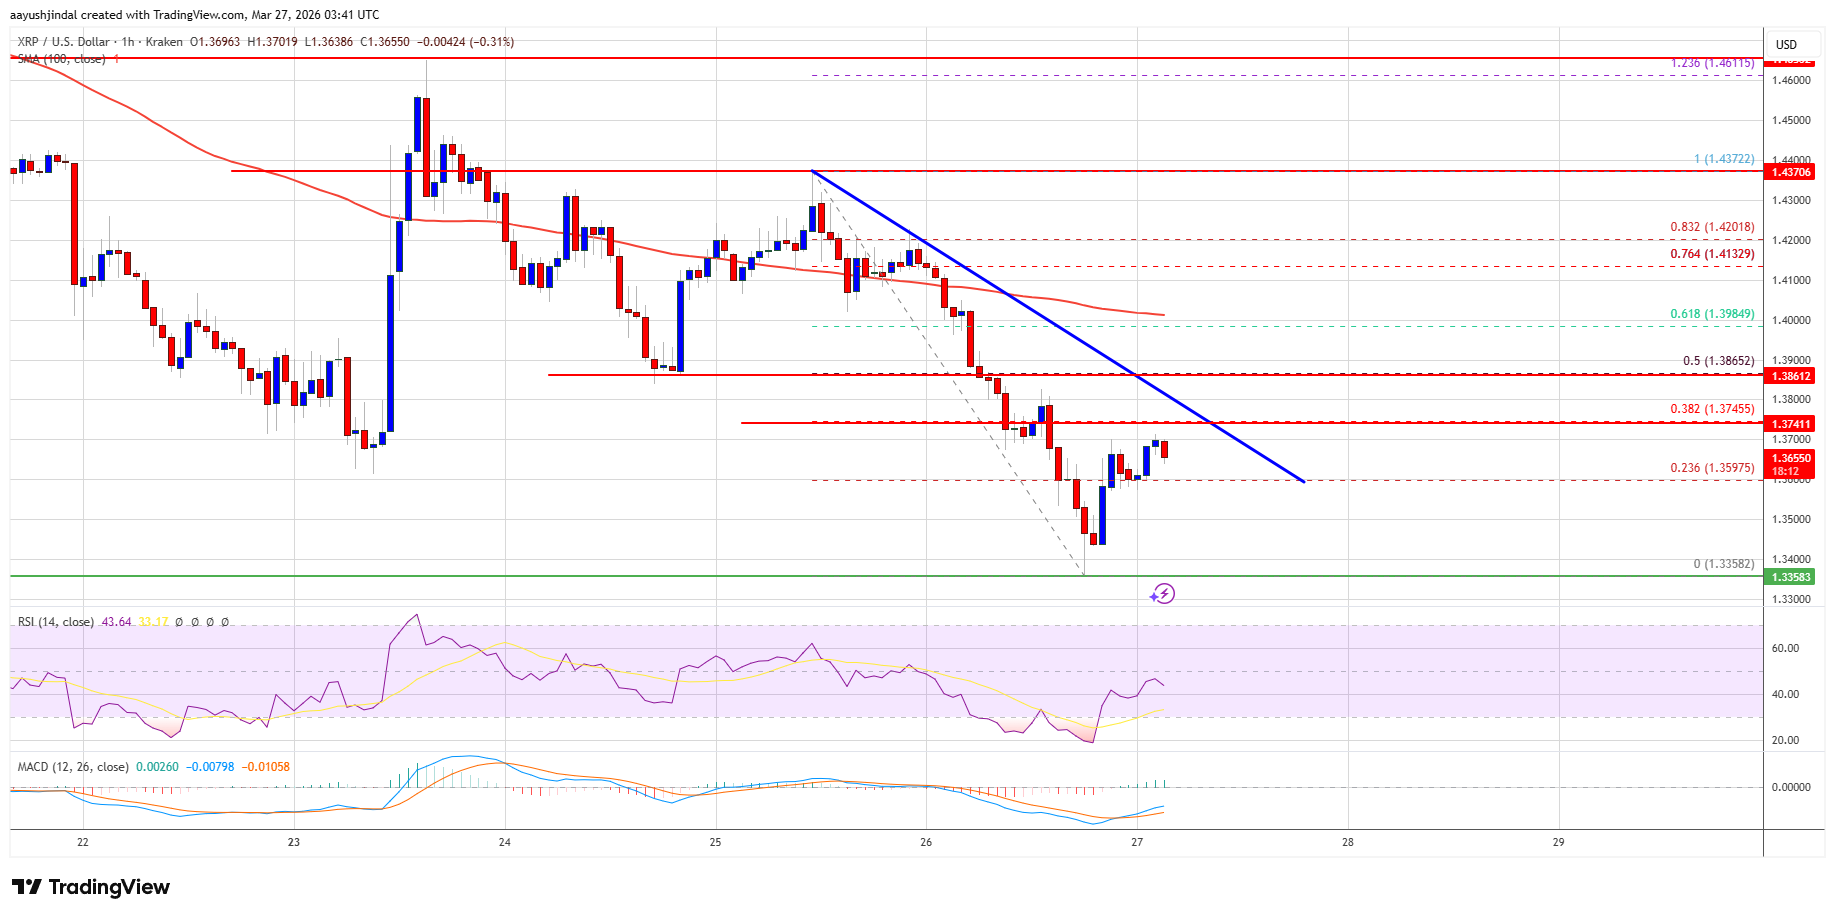
XRP price extended losses and traded below $1.40. The price is now consolidating losses but faces hurdles near $1.3750 and $1.40.
- XRP price started another decline and traded below the $1.40 zone.
- The price is now trading below $1.3880 and the 100-hourly Simple Moving Average.
- There is a bearish trend line forming with resistance at $1.3750 on the hourly chart of the XRP/USD pair (data source from Kraken).
- The pair could continue to move down if it stays below $1.40.
XRP Price Extends Losses
XRP price failed to stay above $1.4120 and extended its decline, like Bitcoin and Ethereum. The price declined below $1.40 and $1.3880 to enter a short-term bearish zone.
The price even extended losses below $1.3750. A low was formed at $1.3358, and the price is now consolidating losses below the 38.2% Fib retracement level of the downward move from the $1.4372 swing high to the $1.3358 low.
The price is now trading below $1.40 and the 100-hourly Simple Moving Average. If there is a fresh recovery move, the price might face resistance near the $1.3750 level. There is also a bearish trend line forming with resistance at $1.3750 on the hourly chart of the XRP/USD pair.
The first major resistance is near the $1.3850 level or the 50% Fib retracement level of the downward move from the $1.4372 swing high to the $1.3358 low. The main resistance could be $1.40.
 Source: XRPUSD on TradingView.com
A close above $1.40 could send the price to $1.4120. The next hurdle sits at $1.4380. A clear move above the $1.4380 resistance might send the price toward the $1.450 resistance. Any more gains might send the price toward the $1.4650 resistance. The next major hurdle for the bulls might be near $1.50.
Another Decline?
If XRP fails to clear the $1.40 resistance zone, it could start a fresh decline. Initial support on the downside is near the $1.350 level. The next major support is near the $1.3350 level.
If there is a downside break and a close below the $1.3350 level, the price might continue to decline toward $1.3220. The next major support sits near the $1.3150 zone, below which the price could continue lower toward $1.30.
Technical Indicators
Hourly MACD – The MACD for XRP/USD is now gaining pace in the bearish zone.
Hourly RSI (Relative Strength Index) – The RSI for XRP/USD is now below the 50 level.
Major Support Levels – $1.3500 and $1.3350.
Major Resistance Levels – $1.3850 and $1.4000.
Disclaimer: The content of this article solely reflects the author's opinion and does not represent the platform in any capacity. This article is not intended to serve as a reference for making investment decisions.
You may also like
The Shopify Stock Rally Isn't Done: Chart of the Week -- Barrons.com
By Doug Busch Shopify is no longer a pandemic-era growth story that simply failed to slow down. It is compounding at a pace few software platforms its size still manage. In the second quarter of 2026, sales on its platform rose 32%. That was the fifth straight quarter of growth exceeding 30%. Merchants are also using more of Shopify's own tools, from payments to Shop Pay, and new channels like AI shopping agents are starting to increase demand. The simple bull case is that the stock already commands a huge share of independent online commerce, and that position should become more valuable as more buying moves through its checkout. A rule of market mechanics is that the vast majority of an individual security's gain is driven by its underlying sector. Within technology, software has staged a robust recovery, joining semiconductors to power the broader sector higher. The iShares Expanded Tech-Software Sector ETF has maintained an upward trajectory since its mid-April lows, though the advance from $74 to $112 has been choppy as bulls repeatedly stepped in to defend when necessary. Breadth across large-cap software has expanded significantly, with 24 constituents surging over 20% over the past three months. During that same three-month window, Shopify generated outstanding relative strength, advancing 36%, more than doubling the IGV's 17% gain over the same period. Expect the stock's outperformance to persist as software momentum broadens. Let's examine the daily and monthly charts to outline the technical drivers behind this thesis. Looking at the daily chart, the ratio chart against the IGV shows persistent outperformance extending back to mid-May. The stock is riding an eight-session winning streak, during which price action cleared a double-bottom-with-handle pivot at $151.39. Within this broader base, the stock recorded a bullish golden cross in late August and successfully filled its Sept. 10 price gap, tracing back to its Aug. 4 session, the day before a powerful earnings reaction sent the stock surging 17% hi
TRexBio: IPO Of 8.3M Shares Priced at $14.00 Each >TRXB
TRexBio: IPO Of 8.3M Shares Priced at $14.00 Each >TRXB
Talos Energy director Barbara J. Faulkenberry files initial beneficial ownership statement
Talos Energy director Barbara J. Faulkenberry filed an initial Form 3 statement dated Oct. 1, 2026. Disclaimer: This news brief was created by Public Technologies (PUBT) using generative artificial intelligence. While PUBT strives to provide accurate and timely information, this AI-generated content is for informational purposes only and should not be interpreted as financial, investment, or legal advice. Talos Energy Inc. published the original content used to generate this news brief via EDGAR, the Electronic Data Gathering, Analysis, and Retrieval system operated by the U.S. Securities and Exchange Commission (Ref. ID: 0001193125-26-418248), on October 08, 2026, and is solely responsible for the information contained therein.
Crypto prices
More


