
Sonic price eyes reversal as bullish RSI divergence forms at $0.03

Sonic price forms bullish RSI divergence near the value area low. Holding $0.03 support could trigger a corrective rally toward $0.04 resistance.
- Bullish Signal: RSI divergence forming near the value area low.
- Key Support: Price must hold $0.03 and the 0.618 Fibonacci level.
- Upside Target: Potential rally toward $0.04 high-timeframe resistance.
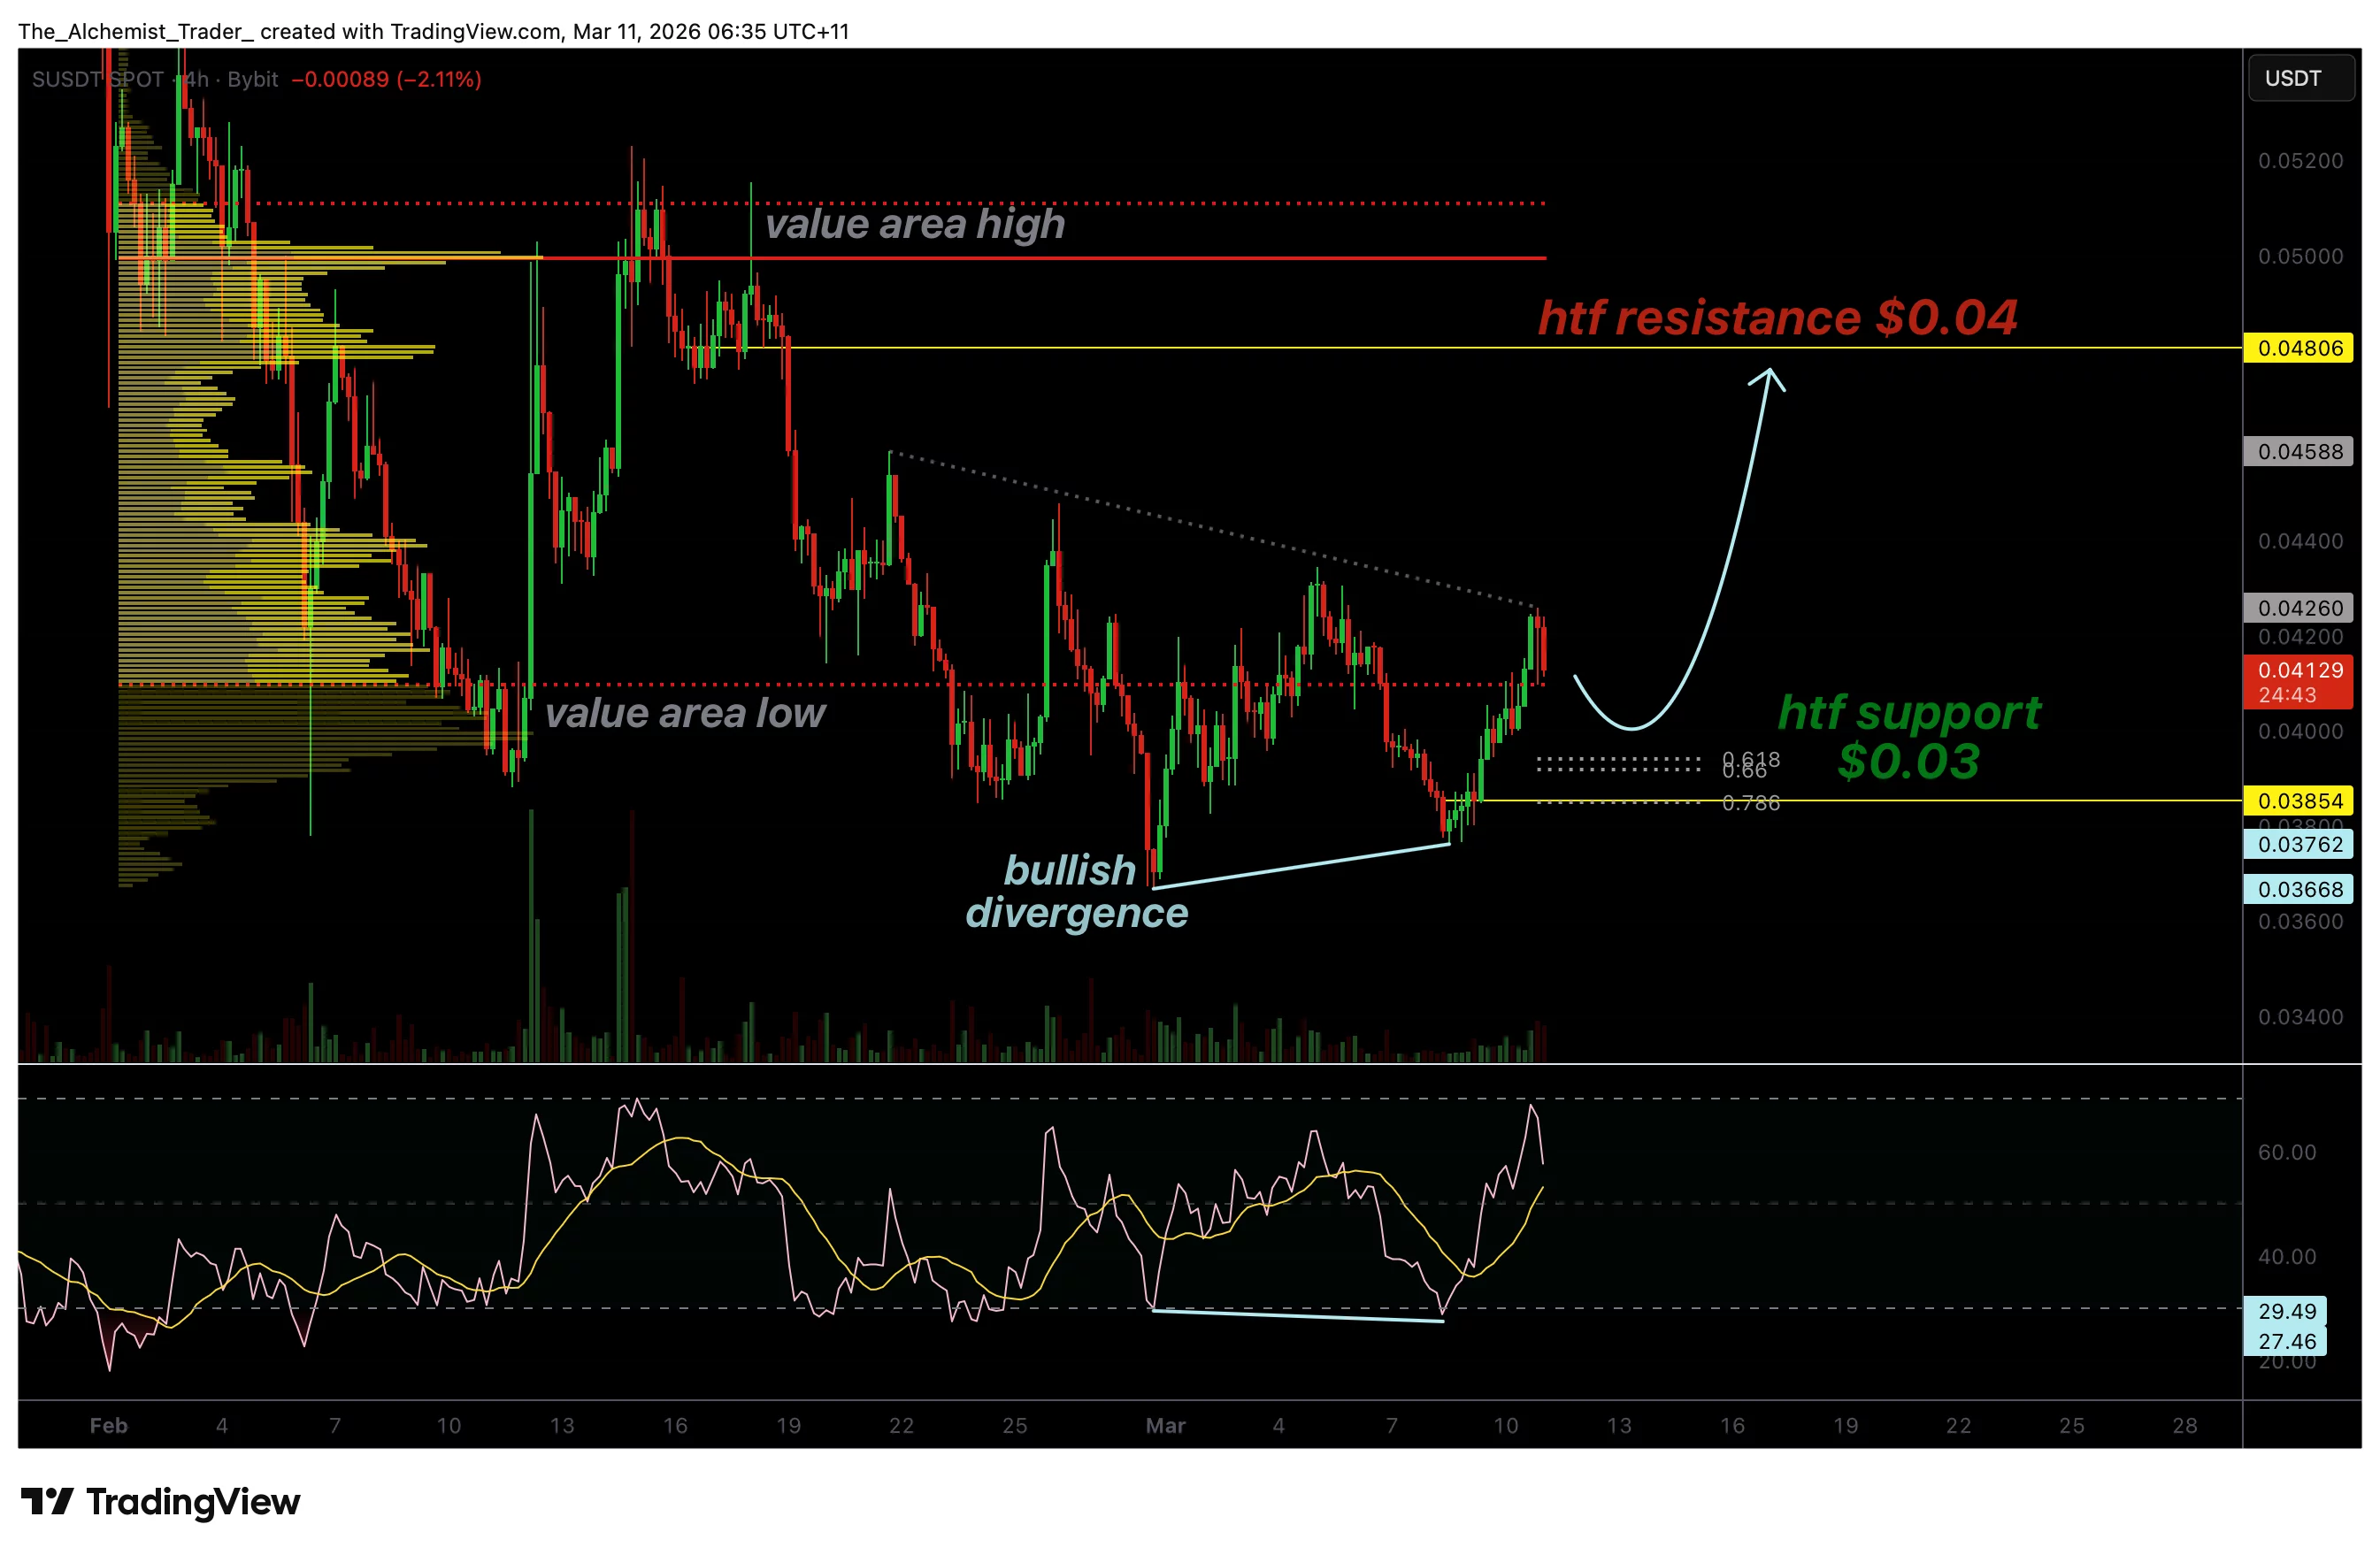
Sonic (S) is currently trading at a critical technical level where early signs of a potential trend reversal are beginning to emerge. After an extended period of downside pressure, the token is now showing bullish RSI divergence around the value area low, a level that has historically attracted buying interest.
This divergence suggests that while price has been printing lower lows, the Relative Strength Index (RSI) has started to form higher lows. In technical analysis, this type of momentum shift often signals that bearish pressure may be weakening and that the market could be preparing for a potential corrective rally.
Sonic price key technical points
- Bullish Divergence: RSI forming higher lows while price prints lower lows.
- Key Support: Sonic holding critical support near $0.03.
- Upside Target: Holding support could open a move toward $0.04 resistance.
 SUSDT (4H) Chart, Source:
Sonic’s recent price action highlights a potential shift in momentum as the market attempts to stabilize after a prolonged decline. The most notable signal on the chart is the presence of a bullish RSI divergence, which has developed near the value area low. This technical formation occurs when price continues to move lower while momentum indicators begin trending higher, suggesting that selling pressure may be gradually fading.
Bullish divergences are commonly observed during the late stages of a downtrend. As the market approaches key support levels, sellers begin to lose momentum while buyers start stepping in at discounted prices. This gradual shift in control between sellers and buyers can often lead to a reversal or, at the very least, a corrective bounce.
In Sonic’s case, the $0.03 level has now emerged as a critical support zone. This level represents an area where buyers have begun defending price, preventing further downside expansion in the immediate short term. The market’s ability to hold above this level will likely determine whether the current bullish divergence develops into a sustained rally or simply results in a temporary relief bounce.
Meanwhile, Sonic Labs has launched USSD, a USD-pegged stablecoin backed by tokenized U.S. Treasury assets, adding a new source of stable liquidity to the Sonic blockchain ecosystem.
Another key technical factor supporting the potential for a reversal is the 0.618 Fibonacci retracement, which aligns closely with the current support structure. The 0.618 Fibonacci level is widely recognized in technical analysis as an important retracement level where markets frequently experience reversals or strong reactions.
When Fibonacci levels align with other technical indicators, such as value areas or support zones, they often create strong areas of technical confluence. In this case, the combination of the value area low, Fibonacci support, and bullish RSI divergence strengthens the probability that the market could attempt a corrective move higher.
Meanwhile, Sonic Labs is entering a new phase under CEO Michael Demeter, who has outlined a long-term roadmap aimed at reshaping how the layer-1 blockchain generates and sustains value.
However, confirmation of this reversal will depend heavily on price behavior in the coming sessions. If Sonic continues to hold above the $0.03 support, it would reinforce the bullish divergence and increase the probability of a structural shift in market behavior.
A successful defense of this support could allow price to rotate higher toward the next major technical barrier, which sits near the $0.04 high-timeframe resistance. This level represents the next area where sellers may attempt to regain control of the market.
From a market structure perspective, a rally toward $0.04 would represent the first meaningful higher high following the recent downtrend. Such a move could signal the early stages of a broader recovery phase if buying momentum continues to strengthen.
What to expect in the coming price action
Sonic is currently positioned at a key technical inflection point as bullish RSI divergence develops near the value area low. As long as price holds above the $0.03 support and respects the 0.618 Fibonacci retracement, the probability increases for a corrective rally toward $0.04 resistance.
A break below $0.03, however, would invalidate the bullish setup and suggest that bearish momentum remains dominant.
Disclaimer: The content of this article solely reflects the author's opinion and does not represent the platform in any capacity. This article is not intended to serve as a reference for making investment decisions.
You may also like
The Shopify Stock Rally Isn't Done: Chart of the Week -- Barrons.com
By Doug Busch Shopify is no longer a pandemic-era growth story that simply failed to slow down. It is compounding at a pace few software platforms its size still manage. In the second quarter of 2026, sales on its platform rose 32%. That was the fifth straight quarter of growth exceeding 30%. Merchants are also using more of Shopify's own tools, from payments to Shop Pay, and new channels like AI shopping agents are starting to increase demand. The simple bull case is that the stock already commands a huge share of independent online commerce, and that position should become more valuable as more buying moves through its checkout. A rule of market mechanics is that the vast majority of an individual security's gain is driven by its underlying sector. Within technology, software has staged a robust recovery, joining semiconductors to power the broader sector higher. The iShares Expanded Tech-Software Sector ETF has maintained an upward trajectory since its mid-April lows, though the advance from $74 to $112 has been choppy as bulls repeatedly stepped in to defend when necessary. Breadth across large-cap software has expanded significantly, with 24 constituents surging over 20% over the past three months. During that same three-month window, Shopify generated outstanding relative strength, advancing 36%, more than doubling the IGV's 17% gain over the same period. Expect the stock's outperformance to persist as software momentum broadens. Let's examine the daily and monthly charts to outline the technical drivers behind this thesis. Looking at the daily chart, the ratio chart against the IGV shows persistent outperformance extending back to mid-May. The stock is riding an eight-session winning streak, during which price action cleared a double-bottom-with-handle pivot at $151.39. Within this broader base, the stock recorded a bullish golden cross in late August and successfully filled its Sept. 10 price gap, tracing back to its Aug. 4 session, the day before a powerful earnings reaction sent the stock surging 17% hi
TRexBio: IPO Of 8.3M Shares Priced at $14.00 Each >TRXB
TRexBio: IPO Of 8.3M Shares Priced at $14.00 Each >TRXB
Talos Energy director Barbara J. Faulkenberry files initial beneficial ownership statement
Talos Energy director Barbara J. Faulkenberry filed an initial Form 3 statement dated Oct. 1, 2026. Disclaimer: This news brief was created by Public Technologies (PUBT) using generative artificial intelligence. While PUBT strives to provide accurate and timely information, this AI-generated content is for informational purposes only and should not be interpreted as financial, investment, or legal advice. Talos Energy Inc. published the original content used to generate this news brief via EDGAR, the Electronic Data Gathering, Analysis, and Retrieval system operated by the U.S. Securities and Exchange Commission (Ref. ID: 0001193125-26-418248), on October 08, 2026, and is solely responsible for the information contained therein.
Crypto prices
More


