
Dogecoin rischia ulteriori perdite mentre il prezzo testa un nuovo supporto critico: analista avverte di un potenziale crollo del 37%

By:Newsbtc
Bitget offers one-stop trading for cryptocurrencies, stocks, and gold. Trade now!
A welcome pack worth 6200 USDT for new users! Sign up now!
Nonostante alcuni osservatori di mercato mantengano l’ottimismo sulle prospettive a lungo termine di Dogecoin (DOGE), un analista ha individuato un pattern di continuazione ribassista nel grafico a breve termine, un segnale che potrebbe preludere a un’altra pesante correzione per la meme coin.
Il minimo di Dogecoin potrebbe trovarsi ancora più in basso
Nella giornata di lunedì, Dogecoin ha segnato un rimbalzo del 3% rispetto ai minimi di domenica, riposizionandosi sopra quota 0,091 $, un livello che era stato perso durante il fine settimana a causa della volatilità scatenata dal conflitto in Medio Oriente.
Nelle ultime due settimane, la criptovaluta è stata scambiata in un range compreso tra 0,086 $ e 0,100 $, toccando un massimo settimanale di 0,104 $ mercoledì scorso prima di annullare i guadagni e scivolare verso i minimi locali, seguendo l’andamento generale del mercato.
var rnd = window.rnd || Math.floor(Math.random()*10e6); var pid607465 = window.pid607465 || rnd; var plc607465 = window.plc607465 || 0; var abkw = window.abkw || ''; var absrc = 'https://servedbyadbutler.com/adserve/;ID=172179;size=0x0;setID=607465;type=js;sw='+screen.width+';sh='+screen.height+';spr='+window.devicePixelRatio+';kw='+abkw+';pid='+pid607465+';place='+(plc607465++)+';rnd='+rnd+';click=CLICK_MACRO_PLACEHOLDER'; document.write('
');
if (!window.AdButler){(function(){var s = document.createElement("script"); s.async = true; s.type = "text/javascript";s.src = "https://servedbyadbutler.com/app.js";var n = document.getElementsByTagName("script")[0]; n.parentNode.insertBefore(s, n);}());}
var AdButler = AdButler || {}; AdButler.ads = AdButler.ads || []; var abkw = window.abkw || ""; var plc366606 = window.plc366606 || 0; (function(){ var divs = document.querySelectorAll(".plc366606:not([id])"); var div = divs[divs.length-1]; div.id = "placement_366606_"+plc366606; AdButler.ads.push({handler: function(opt){ AdButler.register(172179, 366606, [728,90], "placement_366606_"+opt.place, opt); }, opt: { place: plc366606++, keywords: abkw, domain: "servedbyadbutler.com", click:"CLICK_MACRO_PLACEHOLDER" }}); })();
Analizzando questa performance, l’esperto di mercato Ali Martinez ha osservato che la criptovaluta si sta consolidando all’interno di un triangolo discendente a partire dalla correzione di metà gennaio; tale configurazione suggerisce che una prosecuzione della tendenza ribassista potrebbe essere imminente.
Dogecoin $DOGE is consolidating in a triangle, setting up for a 37% price move.
— Ali Charts (@alicharts) March 8, 2026
Dogecoin è scambiata all’interno di una formazione a triangolo discendente. Fonte:
Ali Martinez su X
.
var rnd = window.rnd || Math.floor(Math.random()*10e6); var pid607472 = window.pid607472 || rnd; var plc607472 = window.plc607472 || 0; var abkw = window.abkw || ''; var absrc = 'https://servedbyadbutler.com/adserve/;ID=172179;size=0x0;setID=607472;type=js;sw='+screen.width+';sh='+screen.height+';spr='+window.devicePixelRatio+';kw='+abkw+';pid='+pid607472+';place='+(plc607472++)+';rnd='+rnd+';click=CLICK_MACRO_PLACEHOLDER'; document.write('
');
if (!window.AdButler){(function(){var s = document.createElement("script"); s.async = true; s.type = "text/javascript";s.src = "https://servedbyadbutler.com/app.js";var n = document.getElementsByTagName("script")[0]; n.parentNode.insertBefore(s, n);}());}
var AdButler = AdButler || {}; AdButler.ads = AdButler.ads || []; var abkw = window.abkw || ""; var plc452518 = window.plc452518 || 0; (function(){ var divs = document.querySelectorAll(".plc452518:not([id])"); var div = divs[divs.length-1]; div.id = "placement_452518_"+plc452518; AdButler.ads.push({handler: function(opt){ AdButler.register(172179, 452518, [728,90], "placement_452518_"+opt.place, opt); }, opt: { place: plc452518++, keywords: abkw, domain: "servedbyadbutler.com", click:"CLICK_MACRO_PLACEHOLDER" }}); })();
Il grafico evidenzia come DOGE abbia stabilito una base (floor) intorno a 0,088 $, valore che rappresenta un calo di quasi il 37% rispetto alla parte superiore del pattern. Nel frattempo, la resistenza della linea di tendenza discendente si colloca attualmente in area 0,097 $.
Secondo l’analista, la meme coin si sta preparando per un movimento al ribasso del 37%, con un target potenziale in area 0,060 $ qualora il prezzo dovesse scendere sotto la base del pattern, perdendo definitivamente il ruolo di supporto.
In precedenza, l’analista aveva già avvertito che Dogecoin potrebbe identificare il suo prossimo livello di supporto significativo proprio intorno a tale quota, nel caso in cui la pressione di vendita dovesse persistere. Nello specifico, il livello di 0,060 $ ha funto storicamente da macro resistenza e supporto, segnando il minimo del mercato ribassista nel 2022 e rappresentando un punto di rimbalzo cruciale durante la ripresa del mercato a fine 2023.
var rnd = window.rnd || Math.floor(Math.random()*10e6); var pid607473 = window.pid607473 || rnd; var plc607473 = window.plc607473 || 0; var abkw = window.abkw || ''; var absrc = 'https://servedbyadbutler.com/adserve/;ID=172179;size=0x0;setID=607473;type=js;sw='+screen.width+';sh='+screen.height+';spr='+window.devicePixelRatio+';kw='+abkw+';pid='+pid607473+';place='+(plc607473++)+';rnd='+rnd+';click=CLICK_MACRO_PLACEHOLDER'; document.write('
');
if (!window.AdButler){(function(){var s = document.createElement("script"); s.async = true; s.type = "text/javascript";s.src = 'https://servedbyadbutler.com/app.js';var n = document.getElementsByTagName("script")[0]; n.parentNode.insertBefore(s, n);}());}
var AdButler = AdButler || {}; AdButler.ads = AdButler.ads || []; var abkw = window.abkw || ''; var plc452519 = window.plc452519 || 0; (function(){ var divs = document.querySelectorAll(".plc452519:not([id])"); var div = divs[divs.length-1]; div.id = "placement_452519_"+plc452519; AdButler.ads.push({handler: function(opt){ AdButler.register(172179, 452519, [728,90], 'placement_452519_'+opt.place, opt); }, opt: { place: plc452519++, keywords: abkw, domain: 'servedbyadbutler.com', click:'CLICK_MACRO_PLACEHOLDER' }}); })();
Gli analisti sono ottimisti sul grafico macro di DOGE
Nonostante la performance debole e le previsioni di prezzo ribassiste nel breve periodo, altri osservatori hanno espresso un outlook più incoraggiante per Dogecoin nel medio e lungo termine.
L’analista Trader Tardigrade ha suggerito agli investitori di osservare il grafico di DOGE con una prospettiva più ampia, affermando che la visione macro della meme coin appare “incredibilmente rialzista”. In un post su X, l’analista ha evidenziato un imponente pennant rialzista sul grafico mensile, segnale che un breakout di vasta portata è ormai probabile.
$Doge/monthly#Dogecoin appears a giant Bullish Pennant on Monthly chart 🔥
Zoom out — the bigger picture is insanely bullish.
This pattern has been forming for years, and it's holding well on the support last month. When this breaks to the upside, expect a massive surge 🚀…
— Trader Tardigrade (@TATrader_Alan) March 8, 2026
Stando al grafico, il pattern si sta delineando fin dal breakout del 2021; la criptovaluta ha testato e mantenuto il limite inferiore come supporto due volte negli ultimi cinque anni, innescando un forte rimbalzo dopo ogni test.
Attualmente, Dogecoin ha testato questo livello per la terza volta, riuscendo a chiudere il mese di febbraio sopra il confine inferiore. Se la storia dovesse ripetersi, si verrebbero a creare le condizioni per un nuovo rally di recupero. “Quando avverrà la rottura verso l’alto, aspettatevi un’impennata massiccia. Il setup è pronto”.
Nel frattempo, l’analista Bitcoinsensus ha ipotizzato che la meme coin possa prepararsi a un rally imponente basandosi sulla sua performance ciclica. Come spiegato nel dettaglio, la price action di DOGE si sta sviluppando in “mini cicli” dal minimo del 2022, portando ogni volta a rally più marcati.

Migliori criptovalute su cui investire: perché Bitcoin Hyper sta guadagnando attenzione nel 2026
La struttura è composta da fasi di accumulo, markup (fase di rialzo) e pullback (ritracciamento), che hanno generato rally del 190% e del 480% rispettivamente all’inizio e alla fine del 2024.
Ora, mentre Dogecoin prosegue la sua terza fase di accumulo, potrebbe verificarsi un breakout verso l’area dei 0,75 $ nei prossimi mesi, a condizione che il token riesca a superare la linea di tendenza ribassista annuale e che il pattern dei “mini cicli” si ripeta ancora una volta.
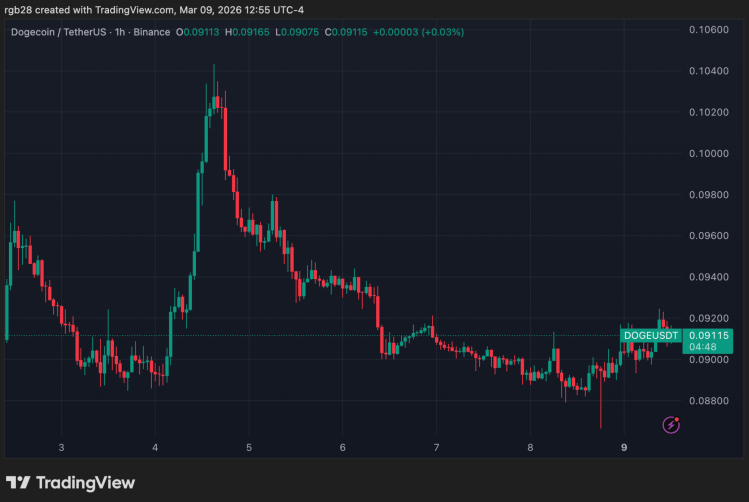
Performance di Dogecoin nel grafico a una settimana. Fonte:
DOGEUSDT su TradingView
.
0
0
Disclaimer: The content of this article solely reflects the author's opinion and does not represent the platform in any capacity. This article is not intended to serve as a reference for making investment decisions.
Understand the market, then trade.
Bitget offers one-stop trading for cryptocurrencies, stocks, and gold.
Trade now!
You may also like
VALERO ENERGY CORP <VLO.N>: JEFFERIES CUTS TARGET PRICE TO $394 FROM $401
VALERO ENERGY CORP : JEFFERIES CUTS TARGET PRICE TO $394 FROM $401
Reuters•2026/10/09 04:52
Gold prices rise Rs 1,500/10g; silver up Rs 3,100/kg ahead of US economic data, softer yields. Buy, sell or hold?
EconomicTimes•2026/10/09 04:51
The Shopify Stock Rally Isn't Done: Chart of the Week -- Barrons.com
By Doug Busch Shopify is no longer a pandemic-era growth story that simply failed to slow down. It is compounding at a pace few software platforms its size still manage. In the second quarter of 2026, sales on its platform rose 32%. That was the fifth straight quarter of growth exceeding 30%. Merchants are also using more of Shopify's own tools, from payments to Shop Pay, and new channels like AI shopping agents are starting to increase demand. The simple bull case is that the stock already commands a huge share of independent online commerce, and that position should become more valuable as more buying moves through its checkout. A rule of market mechanics is that the vast majority of an individual security's gain is driven by its underlying sector. Within technology, software has staged a robust recovery, joining semiconductors to power the broader sector higher. The iShares Expanded Tech-Software Sector ETF has maintained an upward trajectory since its mid-April lows, though the advance from $74 to $112 has been choppy as bulls repeatedly stepped in to defend when necessary. Breadth across large-cap software has expanded significantly, with 24 constituents surging over 20% over the past three months. During that same three-month window, Shopify generated outstanding relative strength, advancing 36%, more than doubling the IGV's 17% gain over the same period. Expect the stock's outperformance to persist as software momentum broadens. Let's examine the daily and monthly charts to outline the technical drivers behind this thesis. Looking at the daily chart, the ratio chart against the IGV shows persistent outperformance extending back to mid-May. The stock is riding an eight-session winning streak, during which price action cleared a double-bottom-with-handle pivot at $151.39. Within this broader base, the stock recorded a bullish golden cross in late August and successfully filled its Sept. 10 price gap, tracing back to its Aug. 4 session, the day before a powerful earnings reaction sent the stock surging 17% hi
Dow Jones•2026/10/09 03:10
Crypto prices
More
Bitcoin
BTC
$82,389.44
-0.60%

Ethereum
ETH
$2,491.9
-3.15%

Tether USDt
USDT
$0.9992
-0.01%

BNB
BNB
$740.72
-3.58%

XRP
XRP
$1.4
-0.86%

USDC
USDC
$0.9998
+0.00%

Solana
SOL
$110.4
-4.37%

TRON
TRX
$0.3320
-0.92%

Hyperliquid
HYPE
$85.61
-1.96%

Zcash
ZEC
$1,220.25
-2.11%
How to buy BTC
Bitget lists BTC – Buy or sell BTC quickly on Bitget!
Trade now
Become a trader now?A welcome pack worth 6200 USDT for new users!
Sign up now