Bitget App
Trade smarter
Buy cryptoMarketsTradeFuturesStocksEarnInstitutionAI & More
XRP Price at Make-or-Break Point, Bollinger Bands Signal

XRP Price at Make-or-Break Point, Bollinger Bands Signal

CryptoNewsNetCryptoNewsNet2026/03/07 17:06
By:CryptoNewsNet
Back to the list

XRP Price at Make-or-Break Point, Bollinger Bands Signal

source-logo  u.today 15 m
image

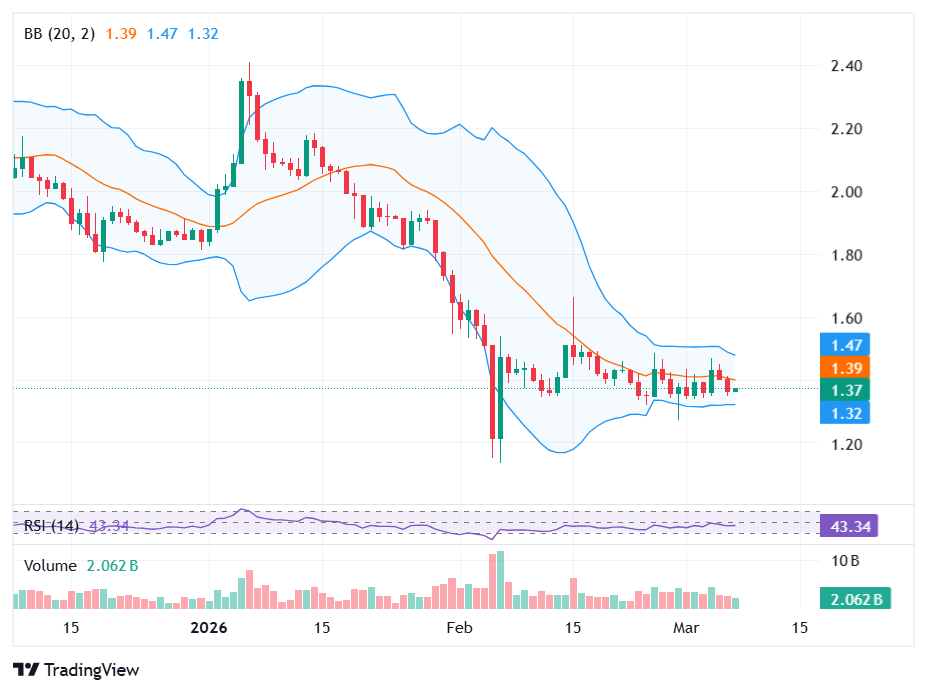
$XRP showed resilience within the last seven days as its price appreciated by 6.29% over the period. The coin’s price is currently at a make-or-break point, as per the Bollinger Bands signal. CoinMarketCap data shows that $XRP’s price is around the middle band.

$XRP is trading near key technical pivot

Notably, this is a pivotal point for $XRP’s price, and the asset could move in either direction depending on market forces. Favorable support from users could drive the coin’s price upward to break resistance levels and reclaim higher levels.

However, if $XRP records low engagement, the asset is likely to continue its volatility struggles in the crypto space with a price around the middle Bollinger Band.
Article image

In the last 24 hours, $XRP has fluctuated between a daily low of $1.35 and a high of $1.41. As of this writing, $XRP changes hands at $1.36, which represents a 2.7% decline within this time frame. The trading volume is also in the red, down by 12.8% at $2.07 billion.

This bearish pressure is as a result of broader global financial market developments, including escalating tensions in the Middle East.

Additionally, the crypto sector has taken a hit after the U.S. showed signs of economic weakness following the February job reports.

A recovery for $XRP is largely hinged on the $1.30 support. If investors increase their buying activity and defend this level, $XRP is likely to rebound to the $1.42 level. The current trading volume does not suggest market participants are willing to go all out to support the coin.

Nonetheless, in the crypto space, the market can swing very fast, and nothing is ruled out. However, if $XRP breaches the $1.30 support, it might increase selling pressure and worsen the downward slip. Such a development could further sink $XRP’s price toward $1.20.

$XRP whale activity and liquidity could trigger breakout

As U.Today reported, within the last 96 hours, there has been an increased liquidity crunch on Binance.

The development remains a potential trigger for an upward price shift. For this to happen, $XRP whales need to step in and halt the downward slip.

Crypto chartist Steph is Crypto argues that $XRP is primed for large holders to move the price much faster than it currently does.

Meanwhile, the asset’s chart indicates two opposing forces at play. Depending on market forces and investors’ participation, $XRP’s price could crash below $1 or soar to $2. The coin has not been able to maintain stability above $2 in the last 30 days.

0
0

Disclaimer: The content of this article solely reflects the author's opinion and does not represent the platform in any capacity. This article is not intended to serve as a reference for making investment decisions.

Understand the market, then trade.
Bitget offers one-stop trading for cryptocurrencies, stocks, and gold.
Trade now!

You may also like

NEWMARK GROUP INC <NMRK.O>: KBW CUTS TARGET PRICE TO $16 FROM $17.50

NEWMARK GROUP INC : KBW CUTS TARGET PRICE TO $16 FROM $17.50

Reuters•2026/10/09 05:31

VALERO ENERGY CORP <VLO.N>: JEFFERIES CUTS TARGET PRICE TO $394 FROM $401

VALERO ENERGY CORP : JEFFERIES CUTS TARGET PRICE TO $394 FROM $401

Reuters•2026/10/09 04:52

The Shopify Stock Rally Isn't Done: Chart of the Week -- Barrons.com

By Doug Busch Shopify is no longer a pandemic-era growth story that simply failed to slow down. It is compounding at a pace few software platforms its size still manage. In the second quarter of 2026, sales on its platform rose 32%. That was the fifth straight quarter of growth exceeding 30%. Merchants are also using more of Shopify's own tools, from payments to Shop Pay, and new channels like AI shopping agents are starting to increase demand. The simple bull case is that the stock already commands a huge share of independent online commerce, and that position should become more valuable as more buying moves through its checkout. A rule of market mechanics is that the vast majority of an individual security's gain is driven by its underlying sector. Within technology, software has staged a robust recovery, joining semiconductors to power the broader sector higher. The iShares Expanded Tech-Software Sector ETF has maintained an upward trajectory since its mid-April lows, though the advance from $74 to $112 has been choppy as bulls repeatedly stepped in to defend when necessary. Breadth across large-cap software has expanded significantly, with 24 constituents surging over 20% over the past three months. During that same three-month window, Shopify generated outstanding relative strength, advancing 36%, more than doubling the IGV's 17% gain over the same period. Expect the stock's outperformance to persist as software momentum broadens. Let's examine the daily and monthly charts to outline the technical drivers behind this thesis. Looking at the daily chart, the ratio chart against the IGV shows persistent outperformance extending back to mid-May. The stock is riding an eight-session winning streak, during which price action cleared a double-bottom-with-handle pivot at $151.39. Within this broader base, the stock recorded a bullish golden cross in late August and successfully filled its Sept. 10 price gap, tracing back to its Aug. 4 session, the day before a powerful earnings reaction sent the stock surging 17% hi

Dow Jones•2026/10/09 03:10