
Is the Ethereum price crash over as network metrics surge?

Ethereum’s price crash continued its strong downward trend this week, reaching its lowest level since June 23 as the crypto market dive accelerated.
- Ethereum price continued its strong downward trend this week.
- The network’s transactions and active users have soared in the last 30 days.
- Technical analysis suggests that ETH price has more downside to go in the near term.
Ethereum (ETH) token dropped to a low of $2,180, down by over 54% from its highest level since August last year. This retreat has brought its market value to over $274 billion.
Ethereum has crashed despite the ongoing network and ecosystem boom as companies like Fidelity, JPMorgan, and Janus Henderson embrace its network for their tokenized assets.
Data compiled by Nansen shows that Ethereum’s network is firing on all cylinders. For example, the number of active addresses jumped by 45% in the last 30 days to over 15 million.
Another metric shows that the number of transactions jumped by 40% in the last 30 days to over 68 million, the highest level in years.
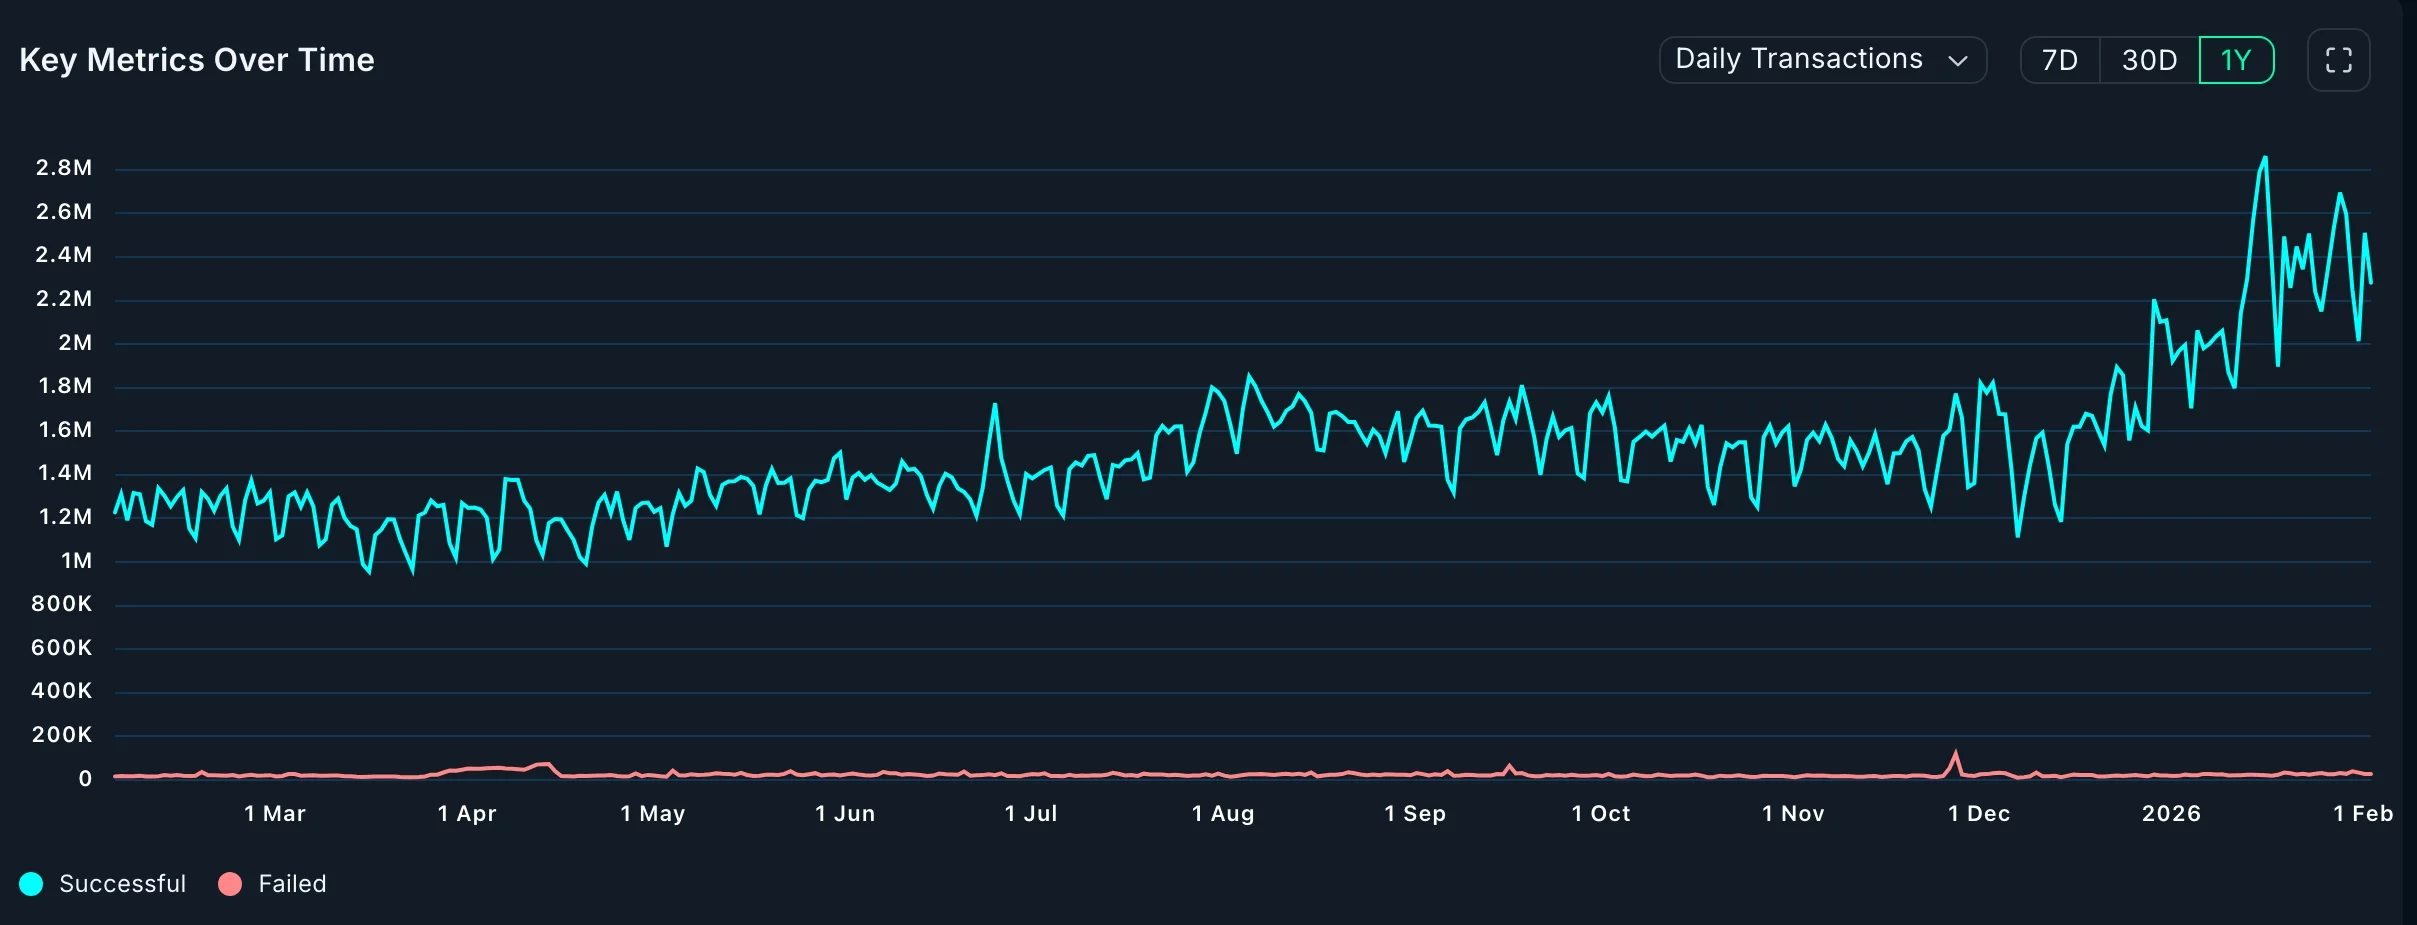 Ethereum transactions have soared | Source: Nansen
This growth has pushed its chain fees to over $15 million, up by 40% in the last 30 days. This growth occurred even as Ethereum transaction fees have continued to fall over the past few months.
More data show that Ethereum’s decentralized exchange network continued to rise in January, a trend that will likely continue in the coming weeks. Its DEX networks rose to over $52.8 billion in January from $49 billion in December last year. The most notable DEX networks are Uniswap, Curve Finance, Fluid, and Balancer.
Most importantly, Ethereum has become a major player in the real-world asset tokenization industry, with its distributed asset value rising by 15% over the last 30 days to over $14.4 billion. Its stablecoin market capitalization rose to over $165 billion.
Ethereum price technical analysis
 ETH price chart | Source:
crypto.news
ETH price chart | Source:
crypto.news
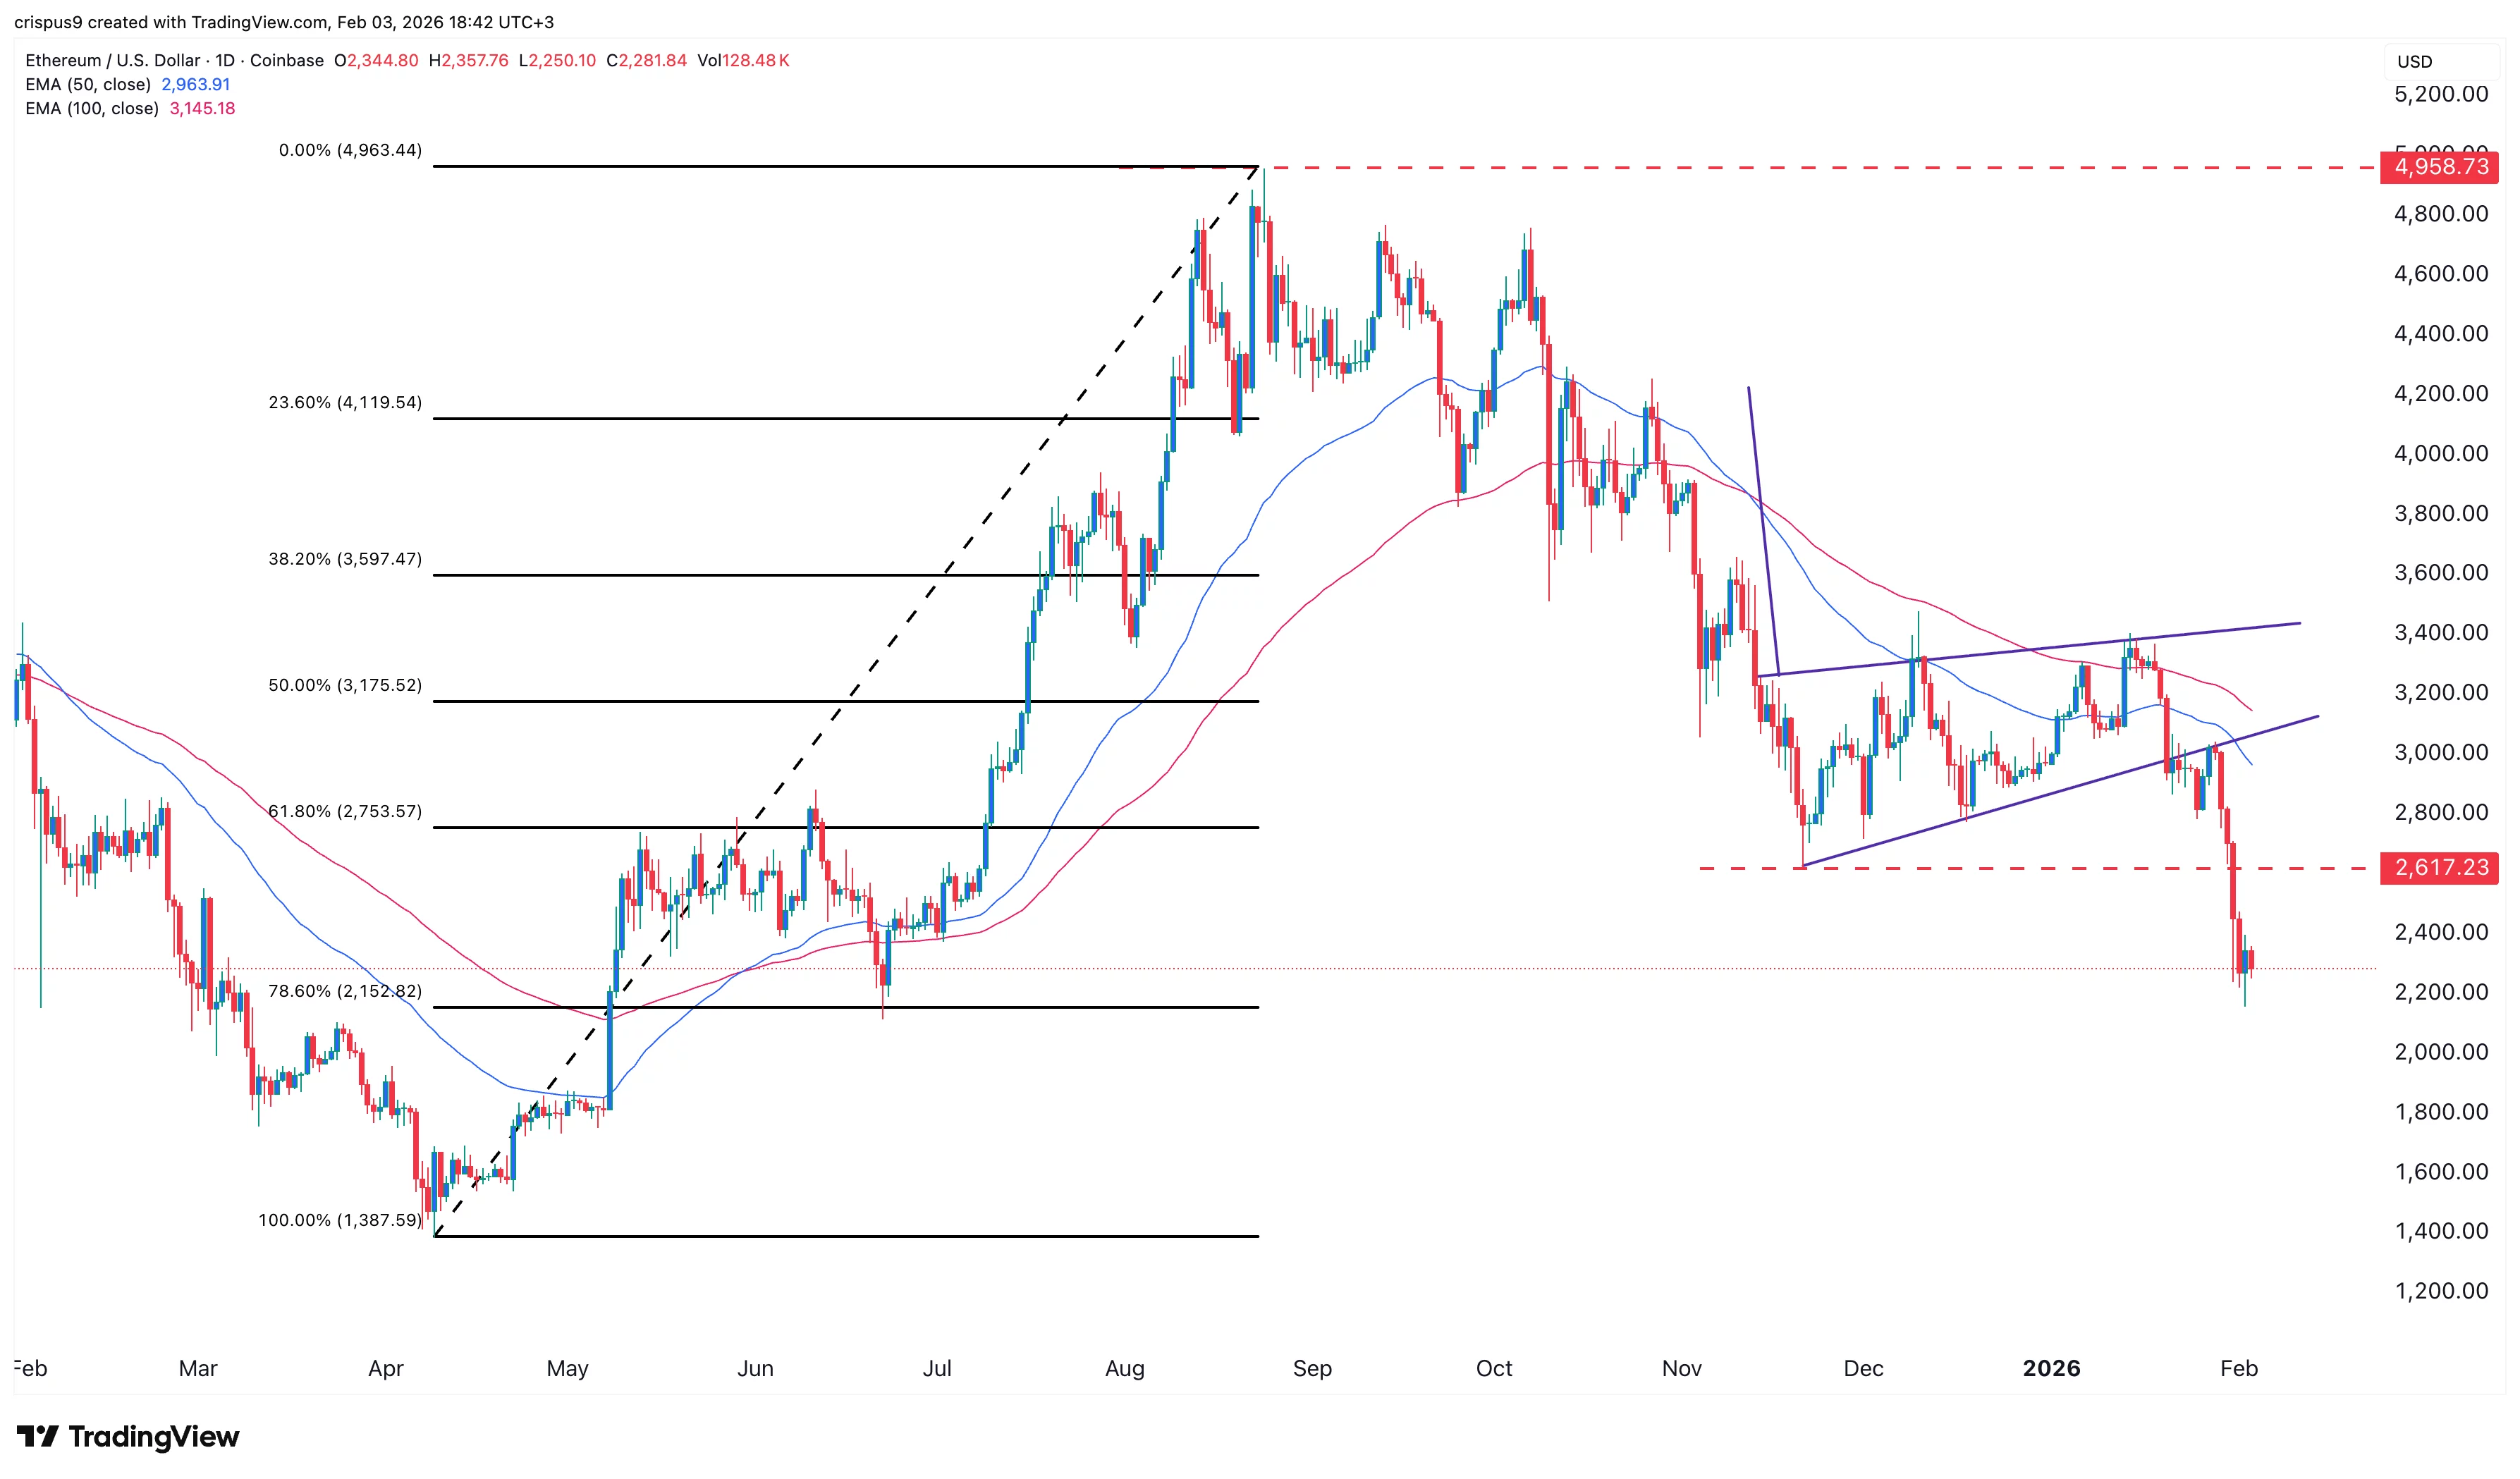
The daily timeframe chart shows that the ETH price has been in a strong downward trend in the past few weeks. It crashed recently after forming a bearish flag pattern, which consists of a vertical line and an ascending channel.
Ethereum price has dropped below the 61.8% Fibonacci Retracement level at $2,753. It moved below the 50-day moving average and Supertrend indicator.
ETH is forming a bearish pennant pattern, a common continuation pattern in technical analysis. It has also moved below the Supertrend indicator.
Therefore, the most likely Ethereum price prediction is bearish, with the next key support level being at $2,000.
Disclaimer: The content of this article solely reflects the author's opinion and does not represent the platform in any capacity. This article is not intended to serve as a reference for making investment decisions.
You may also like
Talos Energy director Barbara J. Faulkenberry files initial beneficial ownership statement
Talos Energy director Barbara J. Faulkenberry filed an initial Form 3 statement dated Oct. 1, 2026. Disclaimer: This news brief was created by Public Technologies (PUBT) using generative artificial intelligence. While PUBT strives to provide accurate and timely information, this AI-generated content is for informational purposes only and should not be interpreted as financial, investment, or legal advice. Talos Energy Inc. published the original content used to generate this news brief via EDGAR, the Electronic Data Gathering, Analysis, and Retrieval system operated by the U.S. Securities and Exchange Commission (Ref. ID: 0001193125-26-418248), on October 08, 2026, and is solely responsible for the information contained therein.
Algorand’s quantum push meets AI payments – Can ALGO’s 17% rally last?
Exchange Traded Funds Top 10 Volume Leaders
NET % VOL STOCK (Symbol) LAST CHG CHG 100s Direxion Semicon Br 3x SOXS 33.79 3.14 10.24 113,576,607 ProShares Bitcoin ETF BITO 10.93 -0.21 -1.89 112,012,221 Direxion Semicon Bl 3x SOXL 142.52 -16.39 -10.31 100,351,229 ProShares Sh Russell2001 RWM 14.43 0.01 0.07 77,482,048 GrShr 2x Sh NVDA Daily NVD 3.55 0.20 5.97 73,813,301 ProShares UltraPro QQQ TQQQ 80.23 -3.39 -4.05 65,485,124 ProSh UltraPro Shrt QQQ SQQQ 33.37 1.30 4.05 60,470,210 iShares Bitcoin Trust ETF IBIT 46.26 -0.95 -2.01 56,191,237 Direxion PLTR Bear 1X PLTD 4.50 -0.11 -2.39 52,552,250 SS Energy Sel SPDR XLE 65.24 1.88 2.97 50,492,628 (END) Dow Jones Newswires October 08, 2026 17:38 ET (21:38 GMT)
--Zoetis Keeps Quarterly Dividend at $0.53 a Share, Payable Dec. 1 to Holders of Record Oct. 30
04:46 PM EDT, 10/08/2026 (MT Newswires) -- Zoetis Keeps Quarterly Dividend at $0.53 a Share, Payable Dec. 1 to Holders of Record Oct. 30
Crypto prices
More


