
Analyst Outlines The Bulllish And Bearish Scenarios For Bitcoin - Here’s What To Know

By:Newsbtc
Bitget offers one-stop trading for cryptocurrencies, stocks, and gold. Trade now!
A welcome pack worth 6200 USDT for new users! Sign up now!
Bitcoin’s price has shown strength over the past 48 hours and is now trading in the mid-$90,000s after days of consolidating around $90,000. Technical analyst Jackis presented a fair assessment of potential paths for Bitcoin’s next significant rise in the context of near-term consolidation and attempted breakouts above $95,000, outlining distinct scenarios for both bulls and bears.
Both Outlooks Have A Case, But Price Has To Confirm
Bitcoin is now back to trading above $95,000 after a 3.1% increase in the past 24 hours. Price action in the past 24 hours alone shows that the outlook might be bullish. However, as it stands, Bitcoin’s price action has reached a point where traders should let the chart tell them what’s next.

According to a technical analysis from a crypto analyst known as Jackis on the social media platform X, arguments alone are not enough here because there are both good bullish & bearish arguments out there for Bitcoin. In his words, he has watched similar-looking price action resolve in opposite directions across different cycles.
var rnd = window.rnd || Math.floor(Math.random()*10e6); var pid607465 = window.pid607465 || rnd; var plc607465 = window.plc607465 || 0; var abkw = window.abkw || ''; var absrc = 'https://servedbyadbutler.com/adserve/;ID=172179;size=0x0;setID=607465;type=js;sw='+screen.width+';sh='+screen.height+';spr='+window.devicePixelRatio+';kw='+abkw+';pid='+pid607465+';place='+(plc607465++)+';rnd='+rnd+';click=CLICK_MACRO_PLACEHOLDER'; document.write('
');
if (!window.AdButler){(function(){var s = document.createElement("script"); s.async = true; s.type = "text/javascript";s.src = "https://servedbyadbutler.com/app.js";var n = document.getElementsByTagName("script")[0]; n.parentNode.insertBefore(s, n);}());}
var AdButler = AdButler || {}; AdButler.ads = AdButler.ads || []; var abkw = window.abkw || ""; var plc366606 = window.plc366606 || 0; (function(){ var divs = document.querySelectorAll(".plc366606:not([id])"); var div = divs[divs.length-1]; div.id = "placement_366606_"+plc366606; AdButler.ads.push({handler: function(opt){ AdButler.register(172179, 366606, [728,90], "placement_366606_"+opt.place, opt); }, opt: { place: plc366606++, keywords: abkw, domain: "servedbyadbutler.com", click:"CLICK_MACRO_PLACEHOLDER" }}); })();
 Source:
Chart from Jackis on X
Source:
Chart from Jackis on X
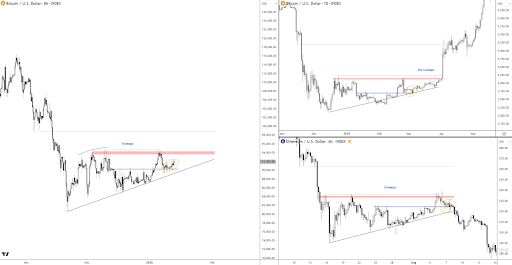
The chart below shows how Bitcoin price action is currently forming an ascending triangle pattern on the 8-hour candlestick timeframe chart. However, examples show how this same formation led to an upward reversal for Bitcoin in the past and then also a bearish continuation for Ethereum in the past.
Based on his read, he currently sees more reasons for downward continuation, and until the market proves otherwise, the active trend is bearish. Both bullish and bearish outlooks have a case, but price action has to confirm.
Bullish And Bearish Scenarios For Bitcoin
Once price breaks out in either direction, the follow-through can be fast, which means being stubborn on the wrong side can be costly.
var rnd = window.rnd || Math.floor(Math.random()*10e6); var pid607472 = window.pid607472 || rnd; var plc607472 = window.plc607472 || 0; var abkw = window.abkw || ''; var absrc = 'https://servedbyadbutler.com/adserve/;ID=172179;size=0x0;setID=607472;type=js;sw='+screen.width+';sh='+screen.height+';spr='+window.devicePixelRatio+';kw='+abkw+';pid='+pid607472+';place='+(plc607472++)+';rnd='+rnd+';click=CLICK_MACRO_PLACEHOLDER'; document.write('
');
if (!window.AdButler){(function(){var s = document.createElement("script"); s.async = true; s.type = "text/javascript";s.src = "https://servedbyadbutler.com/app.js";var n = document.getElementsByTagName("script")[0]; n.parentNode.insertBefore(s, n);}());}
var AdButler = AdButler || {}; AdButler.ads = AdButler.ads || []; var abkw = window.abkw || ""; var plc452518 = window.plc452518 || 0; (function(){ var divs = document.querySelectorAll(".plc452518:not([id])"); var div = divs[divs.length-1]; div.id = "placement_452518_"+plc452518; AdButler.ads.push({handler: function(opt){ AdButler.register(172179, 452518, [728,90], "placement_452518_"+opt.place, opt); }, opt: { place: plc452518++, keywords: abkw, domain: "servedbyadbutler.com", click:"CLICK_MACRO_PLACEHOLDER" }}); })();

On the bullish side, Jackis highlighted that a breakout toward $96,000 is the kind of move that would confirm a bullish continuation. He added that a push through $96,000 at this point could open the path to $107,000 or higher.
On the other hand, Jackis’ bearish trigger is tied to the rising support line. Price action can look constructive right up until the trendline snaps, and that’s the point where downside continuation becomes the higher-probability route in this framework.
If Bitcoin were to lose the lower trendline of the ascending trend, then it would likely drift back to the April 24 lows. The April lows refer to how Bitcoin rejected above $106,100 in January 2025 and entered into a multi-month correction that eventually bottomed at a low around $76,000.
var rnd = window.rnd || Math.floor(Math.random()*10e6); var pid607473 = window.pid607473 || rnd; var plc607473 = window.plc607473 || 0; var abkw = window.abkw || ''; var absrc = 'https://servedbyadbutler.com/adserve/;ID=172179;size=0x0;setID=607473;type=js;sw='+screen.width+';sh='+screen.height+';spr='+window.devicePixelRatio+';kw='+abkw+';pid='+pid607473+';place='+(plc607473++)+';rnd='+rnd+';click=CLICK_MACRO_PLACEHOLDER'; document.write('
');
if (!window.AdButler){(function(){var s = document.createElement("script"); s.async = true; s.type = "text/javascript";s.src = 'https://servedbyadbutler.com/app.js';var n = document.getElementsByTagName("script")[0]; n.parentNode.insertBefore(s, n);}());}
var AdButler = AdButler || {}; AdButler.ads = AdButler.ads || []; var abkw = window.abkw || ''; var plc452519 = window.plc452519 || 0; (function(){ var divs = document.querySelectorAll(".plc452519:not([id])"); var div = divs[divs.length-1]; div.id = "placement_452519_"+plc452519; AdButler.ads.push({handler: function(opt){ AdButler.register(172179, 452519, [728,90], 'placement_452519_'+opt.place, opt); }, opt: { place: plc452519++, keywords: abkw, domain: 'servedbyadbutler.com', click:'CLICK_MACRO_PLACEHOLDER' }}); })();
This means that a clean breakdown could change the conversation away from range chop in the mid-$90,000s to a reset.
 BTC trading at $95,023 on the 1D chart | Source: BTCUSDT on
Tradingview.com
BTC trading at $95,023 on the 1D chart | Source: BTCUSDT on
Tradingview.com
0
0
Disclaimer: The content of this article solely reflects the author's opinion and does not represent the platform in any capacity. This article is not intended to serve as a reference for making investment decisions.
Understand the market, then trade.
Bitget offers one-stop trading for cryptocurrencies, stocks, and gold.
Trade now!
You may also like
The Shopify Stock Rally Isn't Done: Chart of the Week -- Barrons.com
By Doug Busch Shopify is no longer a pandemic-era growth story that simply failed to slow down. It is compounding at a pace few software platforms its size still manage. In the second quarter of 2026, sales on its platform rose 32%. That was the fifth straight quarter of growth exceeding 30%. Merchants are also using more of Shopify's own tools, from payments to Shop Pay, and new channels like AI shopping agents are starting to increase demand. The simple bull case is that the stock already commands a huge share of independent online commerce, and that position should become more valuable as more buying moves through its checkout. A rule of market mechanics is that the vast majority of an individual security's gain is driven by its underlying sector. Within technology, software has staged a robust recovery, joining semiconductors to power the broader sector higher. The iShares Expanded Tech-Software Sector ETF has maintained an upward trajectory since its mid-April lows, though the advance from $74 to $112 has been choppy as bulls repeatedly stepped in to defend when necessary. Breadth across large-cap software has expanded significantly, with 24 constituents surging over 20% over the past three months. During that same three-month window, Shopify generated outstanding relative strength, advancing 36%, more than doubling the IGV's 17% gain over the same period. Expect the stock's outperformance to persist as software momentum broadens. Let's examine the daily and monthly charts to outline the technical drivers behind this thesis. Looking at the daily chart, the ratio chart against the IGV shows persistent outperformance extending back to mid-May. The stock is riding an eight-session winning streak, during which price action cleared a double-bottom-with-handle pivot at $151.39. Within this broader base, the stock recorded a bullish golden cross in late August and successfully filled its Sept. 10 price gap, tracing back to its Aug. 4 session, the day before a powerful earnings reaction sent the stock surging 17% hi
Dow Jones•2026/10/09 03:10
TRexBio: IPO Of 8.3M Shares Priced at $14.00 Each >TRXB
TRexBio: IPO Of 8.3M Shares Priced at $14.00 Each >TRXB
Dow Jones•2026/10/09 01:47
Talos Energy director Barbara J. Faulkenberry files initial beneficial ownership statement
Talos Energy director Barbara J. Faulkenberry filed an initial Form 3 statement dated Oct. 1, 2026. Disclaimer: This news brief was created by Public Technologies (PUBT) using generative artificial intelligence. While PUBT strives to provide accurate and timely information, this AI-generated content is for informational purposes only and should not be interpreted as financial, investment, or legal advice. Talos Energy Inc. published the original content used to generate this news brief via EDGAR, the Electronic Data Gathering, Analysis, and Retrieval system operated by the U.S. Securities and Exchange Commission (Ref. ID: 0001193125-26-418248), on October 08, 2026, and is solely responsible for the information contained therein.
Bitget•2026/10/09 01:05
Crypto prices
More
Bitcoin
BTC
$82,124.03
-0.97%

Ethereum
ETH
$2,486.28
-3.26%

Tether USDt
USDT
$0.9992
+0.01%

BNB
BNB
$739.68
-4.01%

XRP
XRP
$1.39
-1.97%

USDC
USDC
$0.9999
+0.02%

Solana
SOL
$110.15
-4.99%

TRON
TRX
$0.3320
-1.12%

Hyperliquid
HYPE
$85.24
-3.07%

Zcash
ZEC
$1,220.31
-6.64%
How to buy BTC
Bitget lists BTC – Buy or sell BTC quickly on Bitget!
Trade now
Become a trader now?A welcome pack worth 6200 USDT for new users!
Sign up now