
Did The 22% Merlin Chain (MERL) Price Rally Just Confirm A Bull Trap?

Merlin Chain (MERL) is a Bitcoin Layer-2 project designed to enable faster, cheaper transactions on the Bitcoin network. The token is up about 22.5% in the past 24 hours and trades near $0.31. Over three months, the Merlin Chain price is still up about 171%. But the past month tells a different story. In that
Merlin Chain (MERL) is a Bitcoin Layer-2 project designed to enable faster, cheaper transactions on the Bitcoin network. The token is up about 22.5% in the past 24 hours and trades near $0.31. Over three months, the Merlin Chain price is still up about 171%. But the past month tells a different story. In that window, MERL is down about 15%, even after the latest spike.
So the question is simple. Did this sharp move up strengthen the trend, or was it more of an outlier? The charts suggest that the 24-hour window rally only strengthened its trend reversal theory. And not in a good way!
Rally Looks Strong, But The Underlying Signals Do Not
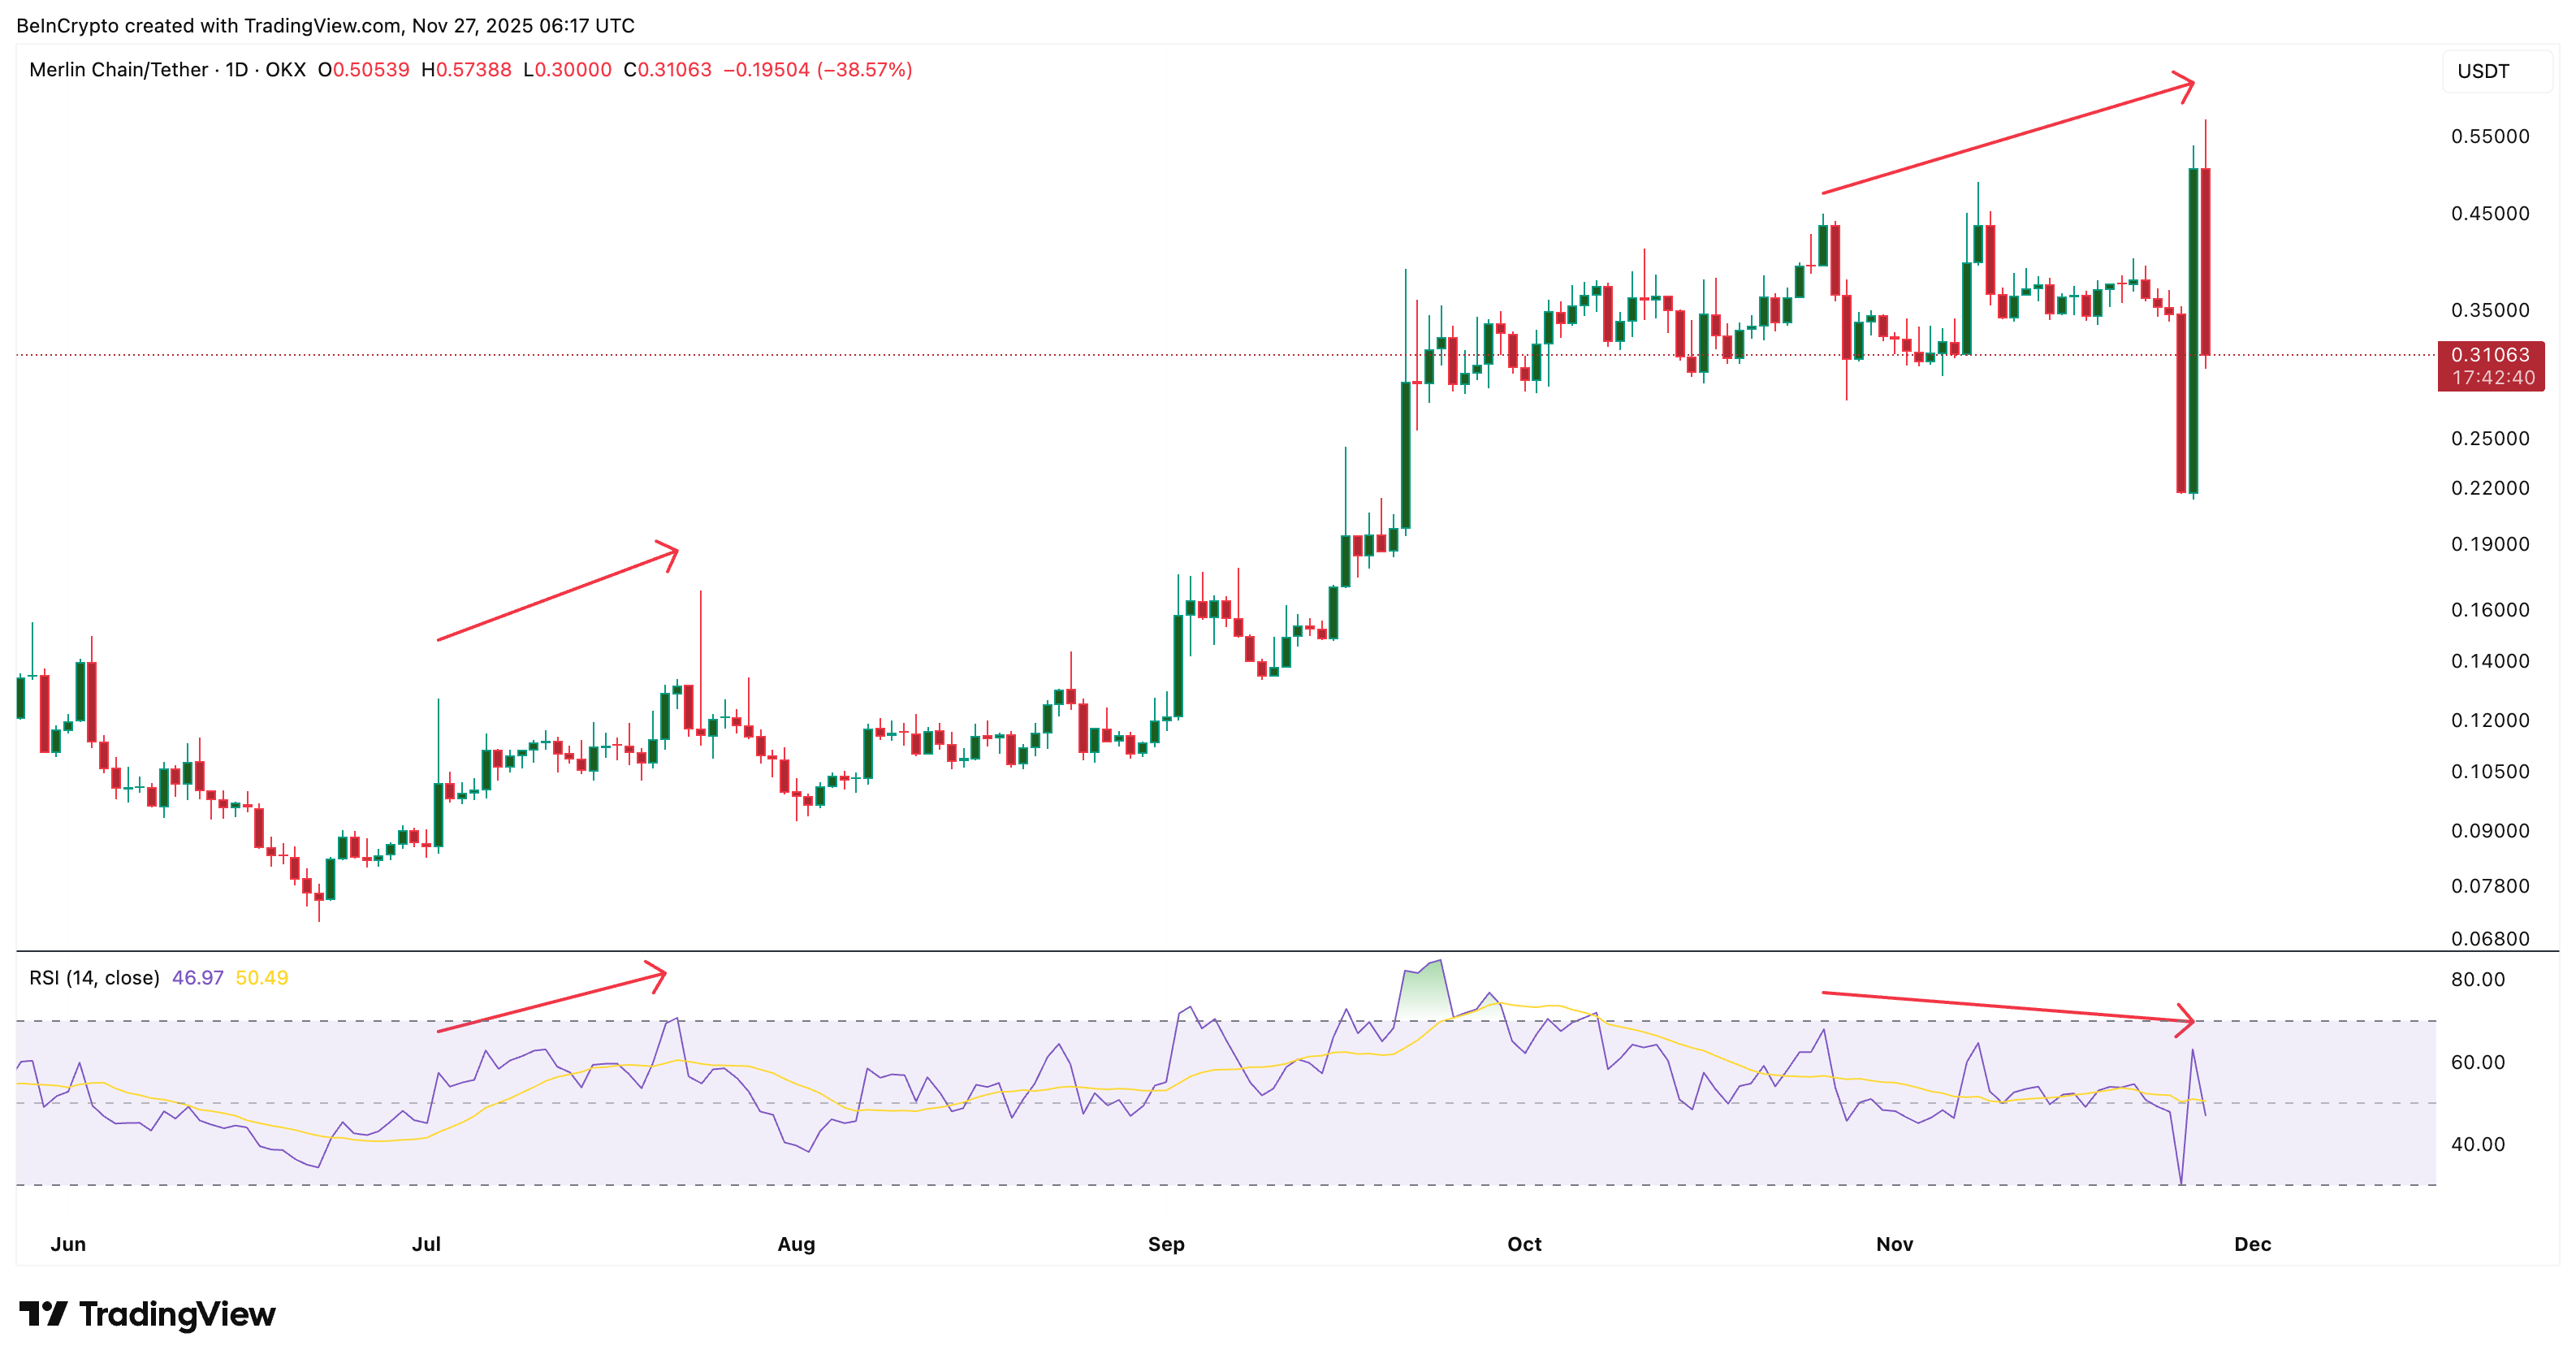
Earlier in Merlin Chain’s long uptrend, starting around late June, the price and the Relative Strength Index (RSI) moved together. RSI measures buying and selling strength, and both the price highs and RSI highs kept rising. That is how a healthy rally behaves.
The past month breaks that pattern. Between October 26 and November 26, the Merlin Chain price made a higher high. RSI produced a lower high. That is standard bearish divergence. It often appears near the end of an uptrend, signaling that the next leg may turn down.
 MERL Trend Reversal Coming:
TradingView
MERL Trend Reversal Coming:
TradingView
Want more token insights like this? Sign up for Editor Harsh Notariya’s Daily Crypto Newsletter here.
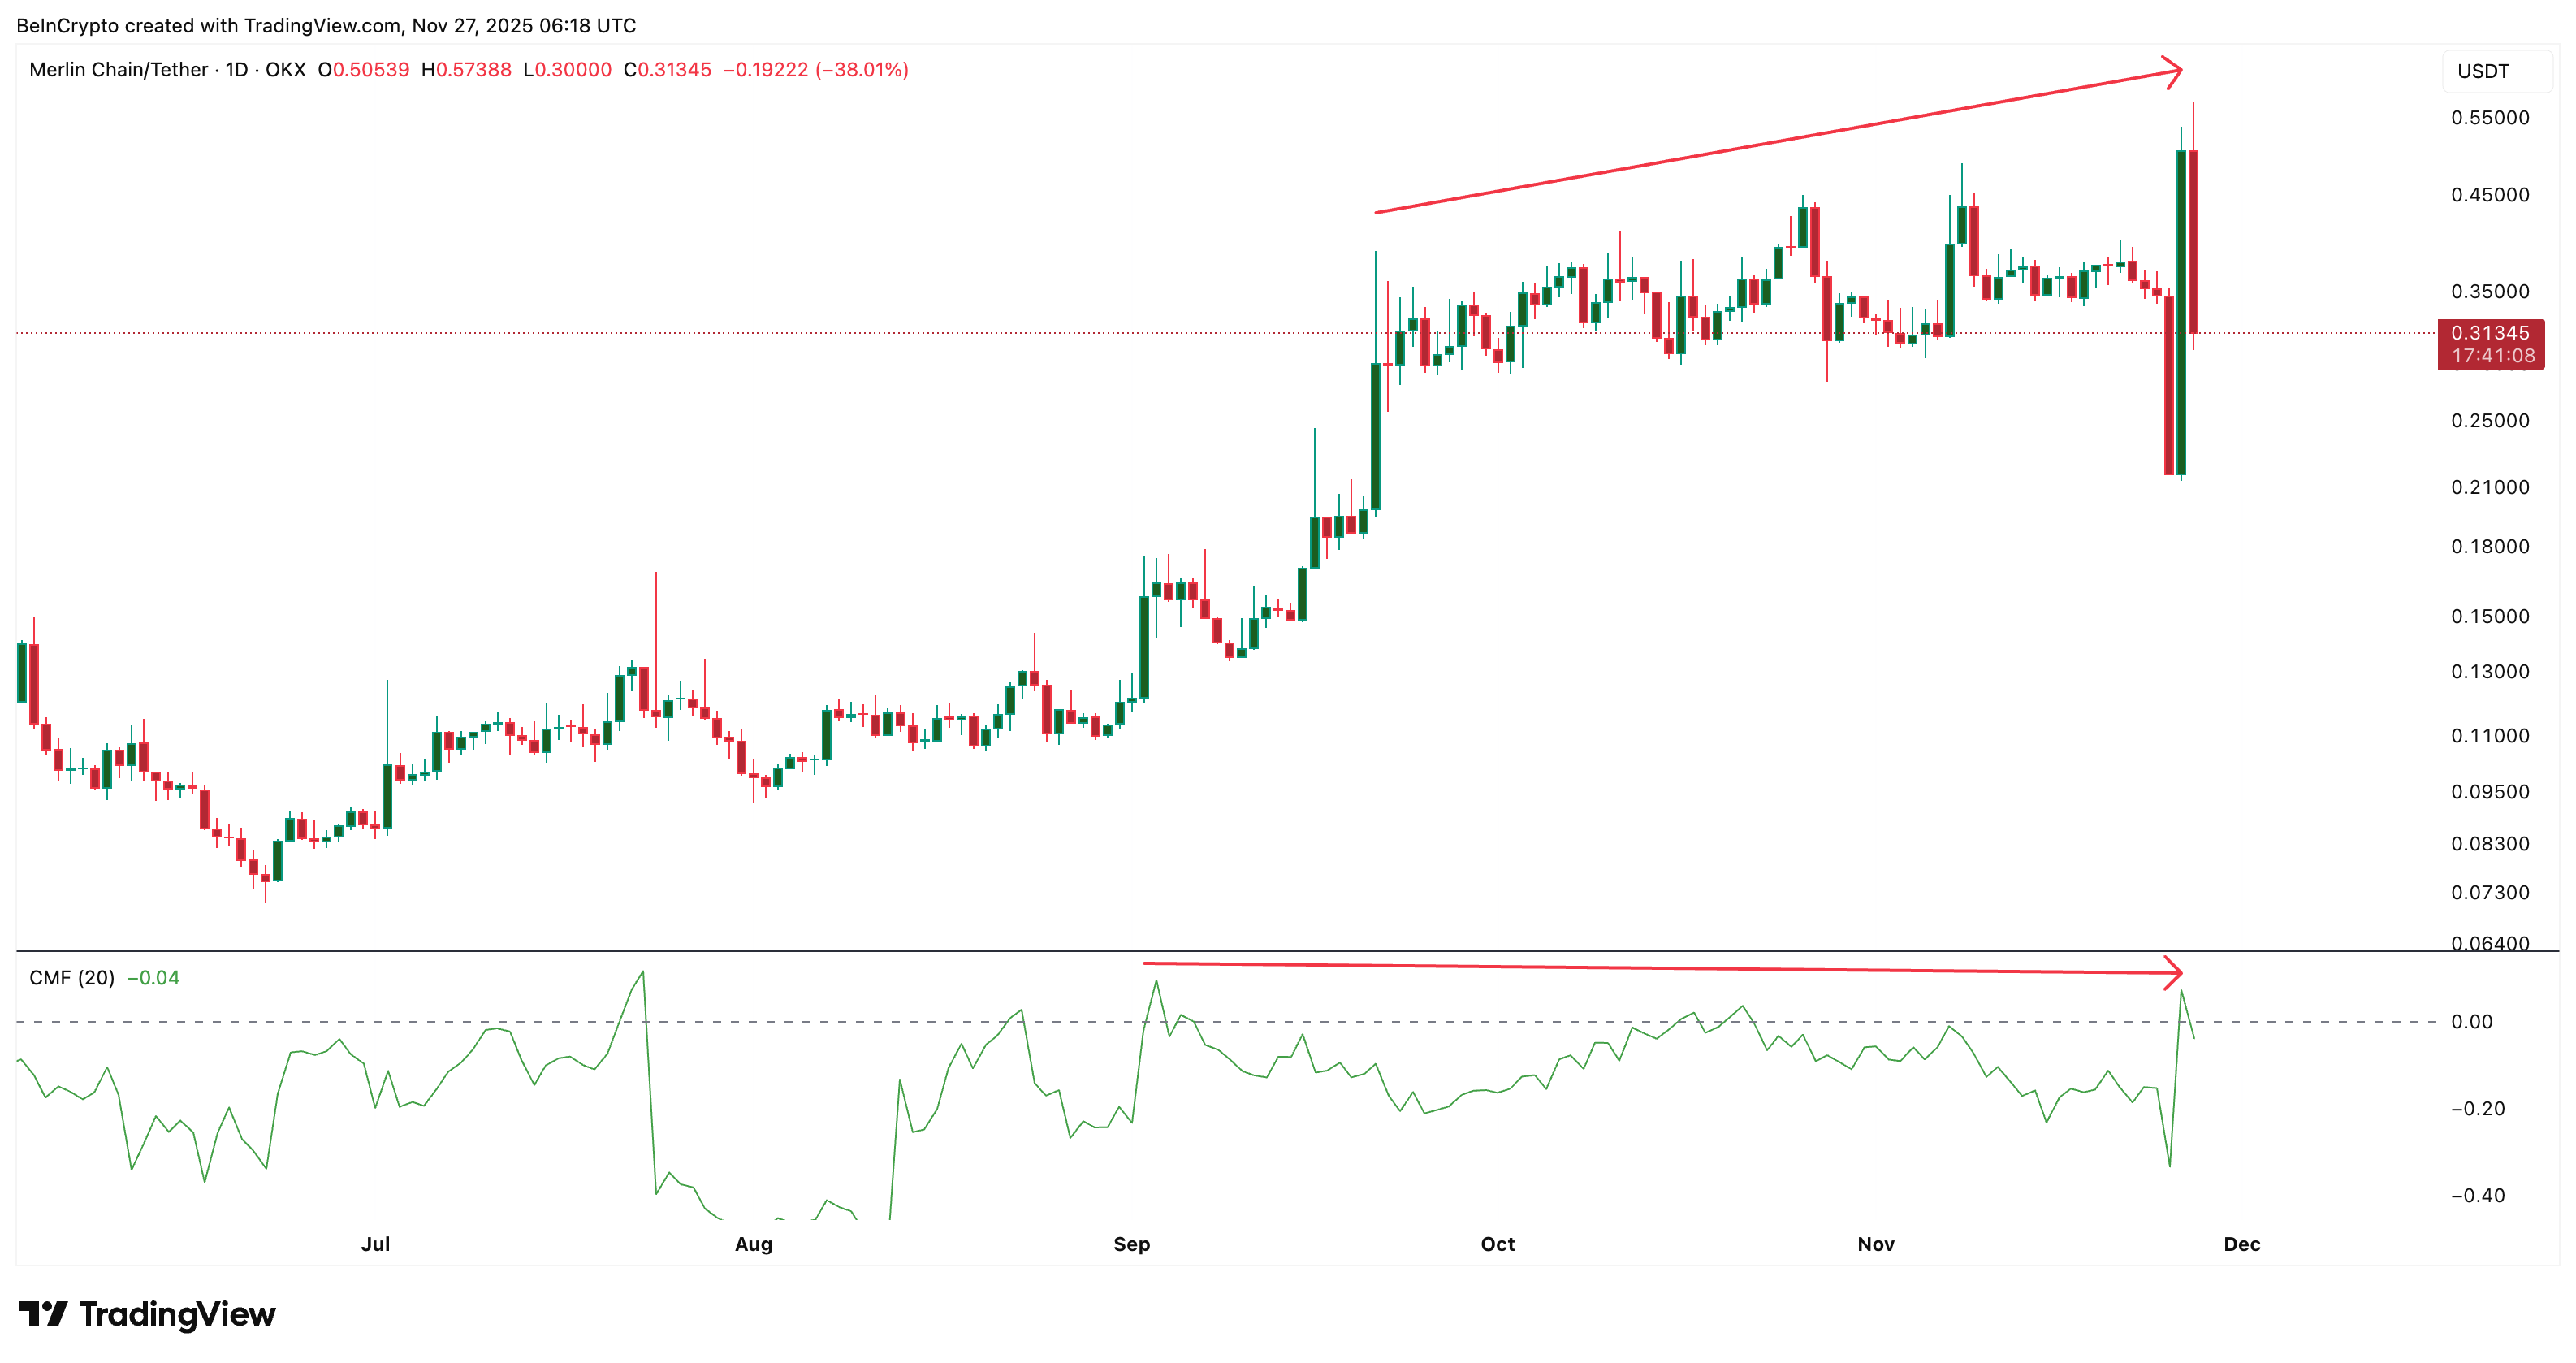
Chaikin Money Flow (CMF), which tracks whether big buyers are supporting the move, adds more pressure.
From September 21 to November 26, the MERL price made higher highs again. CMF made lower highs and has now fallen under the zero line. A drop under zero, while forming bearish divergence against the price, means large-money inflows have weakened even while the chart pushed to new highs.
 Big Money Slows Down:
TradingView
Big Money Slows Down:
TradingView
The 22% spike did not fix this. In fact, the candle right after the jump turned red, showing that sellers used the strength to exit instead of joining. When both RSI and CMF weaken while price hits new highs, the setup often hints at a bull trap — a fast move up that lures buyers in before the trend reverses.
Key Merlin Chain Price Levels Now Decide If The Uptrend Survives
Now, the existing Merlin Chain price levels decide everything.
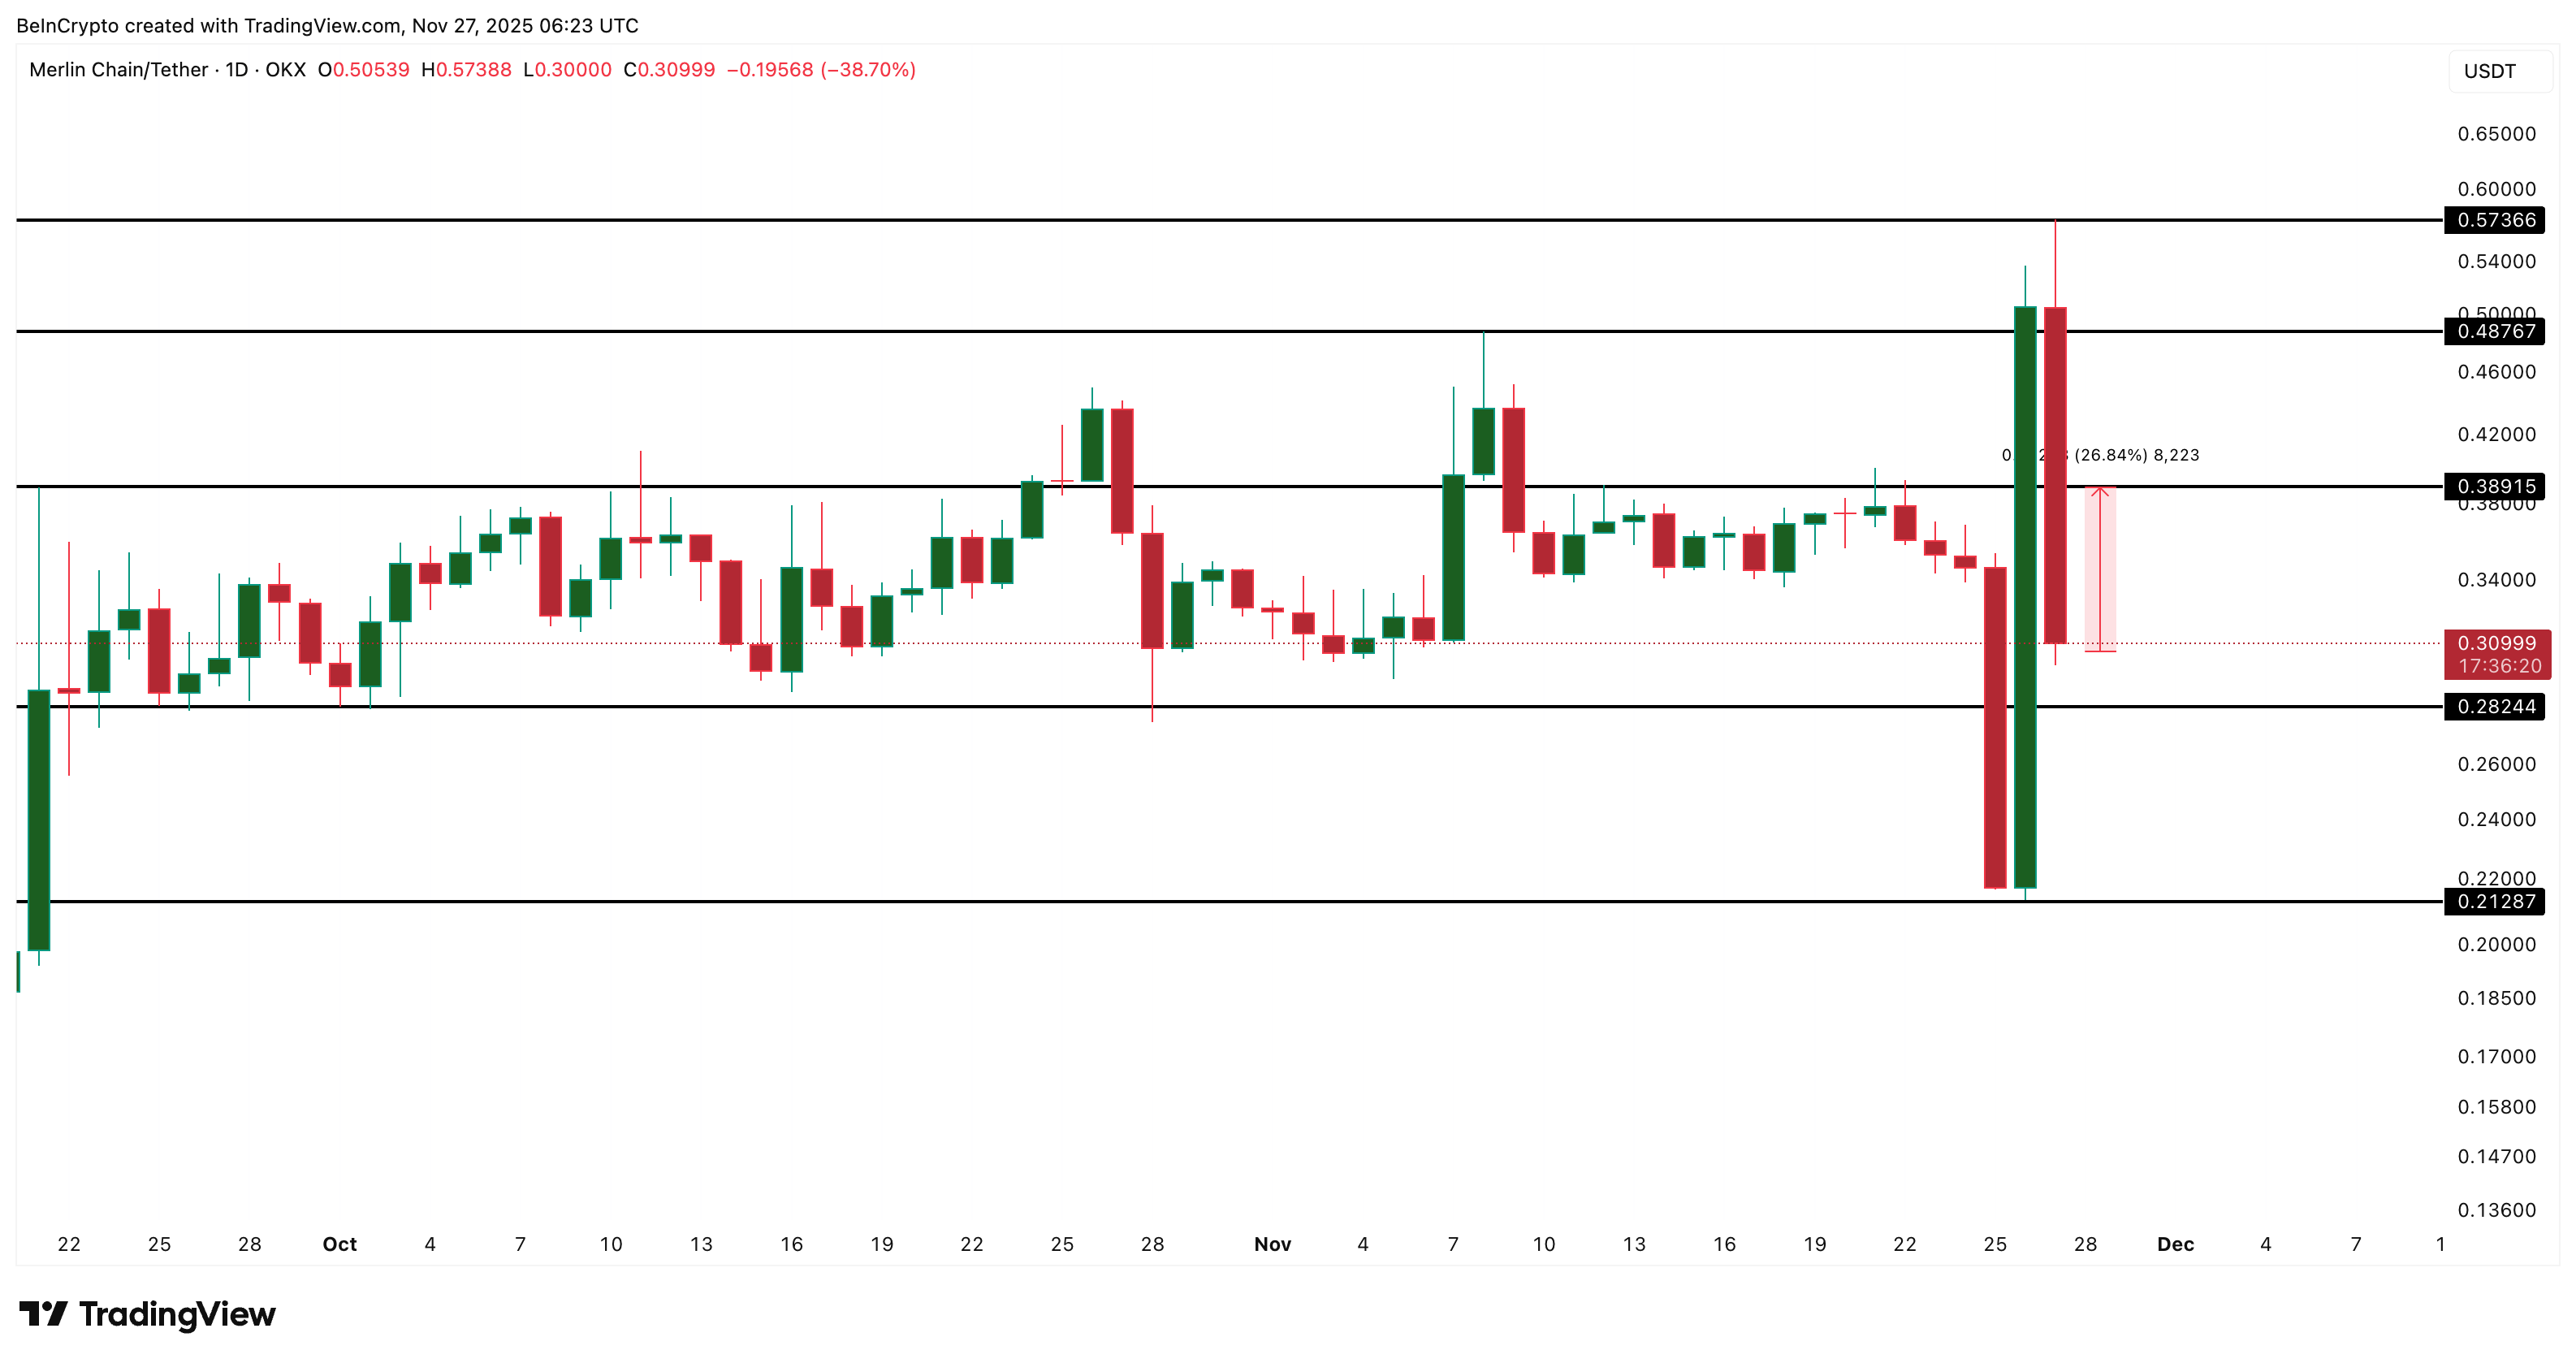
The first major resistance sits at $0.38. A clean daily close above $0.38 would weaken the divergence setup and let MERL aim for $0.48 and then $0.57, the near-term peak. That would be the signal that the broader rally from June still holds. However, the move would still need CMF support.
If MERL fails to clear $0.38 and falls under $0.28, the reversal setup grows stronger. The line that confirms the downtrend sits near $0.21. A daily close below $0.21 would complete a clear top and flip the whole three-month structure into a confirmed trend reversal.
 Merlin Chain Price Analysis:
TradingView
Merlin Chain Price Analysis:
TradingView
Right now, the message is straightforward. MERL’s 22% rally saved the short-term chart, but it also revealed that momentum and big-wallet demand are fading. If the key levels fail, this spike will be remembered not as a breakout, but as the move that confirmed the start of the downtrend. And it might even look like a “bull trap” for those who entered at $0.57 or nearby levels.
Read the article at BeInCryptoDisclaimer: The content of this article solely reflects the author's opinion and does not represent the platform in any capacity. This article is not intended to serve as a reference for making investment decisions.
You may also like
Talos Energy director Barbara J. Faulkenberry files initial beneficial ownership statement
Talos Energy director Barbara J. Faulkenberry filed an initial Form 3 statement dated Oct. 1, 2026. Disclaimer: This news brief was created by Public Technologies (PUBT) using generative artificial intelligence. While PUBT strives to provide accurate and timely information, this AI-generated content is for informational purposes only and should not be interpreted as financial, investment, or legal advice. Talos Energy Inc. published the original content used to generate this news brief via EDGAR, the Electronic Data Gathering, Analysis, and Retrieval system operated by the U.S. Securities and Exchange Commission (Ref. ID: 0001193125-26-418248), on October 08, 2026, and is solely responsible for the information contained therein.
Algorand’s quantum push meets AI payments – Can ALGO’s 17% rally last?
Exchange Traded Funds Top 10 Volume Leaders
NET % VOL STOCK (Symbol) LAST CHG CHG 100s Direxion Semicon Br 3x SOXS 33.79 3.14 10.24 113,576,607 ProShares Bitcoin ETF BITO 10.93 -0.21 -1.89 112,012,221 Direxion Semicon Bl 3x SOXL 142.52 -16.39 -10.31 100,351,229 ProShares Sh Russell2001 RWM 14.43 0.01 0.07 77,482,048 GrShr 2x Sh NVDA Daily NVD 3.55 0.20 5.97 73,813,301 ProShares UltraPro QQQ TQQQ 80.23 -3.39 -4.05 65,485,124 ProSh UltraPro Shrt QQQ SQQQ 33.37 1.30 4.05 60,470,210 iShares Bitcoin Trust ETF IBIT 46.26 -0.95 -2.01 56,191,237 Direxion PLTR Bear 1X PLTD 4.50 -0.11 -2.39 52,552,250 SS Energy Sel SPDR XLE 65.24 1.88 2.97 50,492,628 (END) Dow Jones Newswires October 08, 2026 17:38 ET (21:38 GMT)
--Zoetis Keeps Quarterly Dividend at $0.53 a Share, Payable Dec. 1 to Holders of Record Oct. 30
04:46 PM EDT, 10/08/2026 (MT Newswires) -- Zoetis Keeps Quarterly Dividend at $0.53 a Share, Payable Dec. 1 to Holders of Record Oct. 30
Crypto prices
More


