
Bitcoin's "Escape Plan"

Source: The DeFi Report
Original Title: Is it True that BTC "lags" Global Liquidity?
Compiled and organized by: BitpushNews
Does Bitcoin really "lag" behind global liquidity?
Hello readers.
We can use many tools and frameworks to understand Bitcoin's price behavior. For example, MV = PQ, stock-to-flow model, network value to transaction volume ratio, network value to Metcalfe's Law, realized price and MVRV ratio, production cost, and many other indicators.
However, in a bull market, everything boils down to liquidity conditions.
In this report, let's take a look at the relationship between Bitcoin and global liquidity.
Bitcoin and Global Liquidity
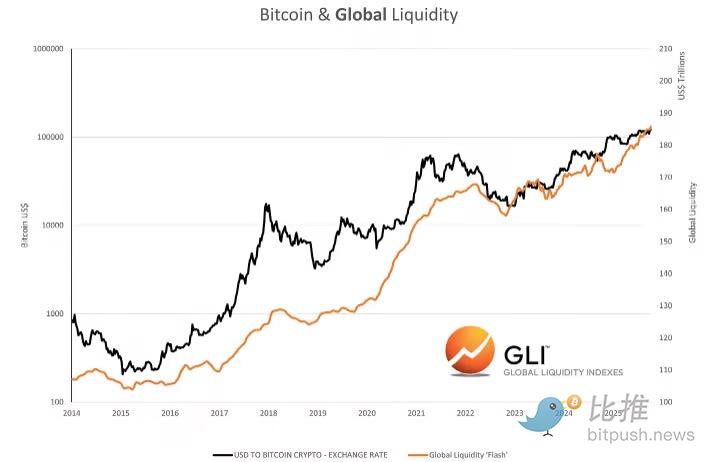
Data source: Global Liquidity Indexes
According to Global Liquidity Indexes: "Historical data shows that changes in liquidity often precede changes in risk asset prices, with a lag of about three months. Specifically, increases in global liquidity are often accompanied by positive performance in risk assets, while decreases in liquidity often foreshadow weak price trends."
Additionally, according to Raoul Pal of Global Macro Investor, global liquidity explains 90% of Bitcoin's price behavior.
What are we seeing today?
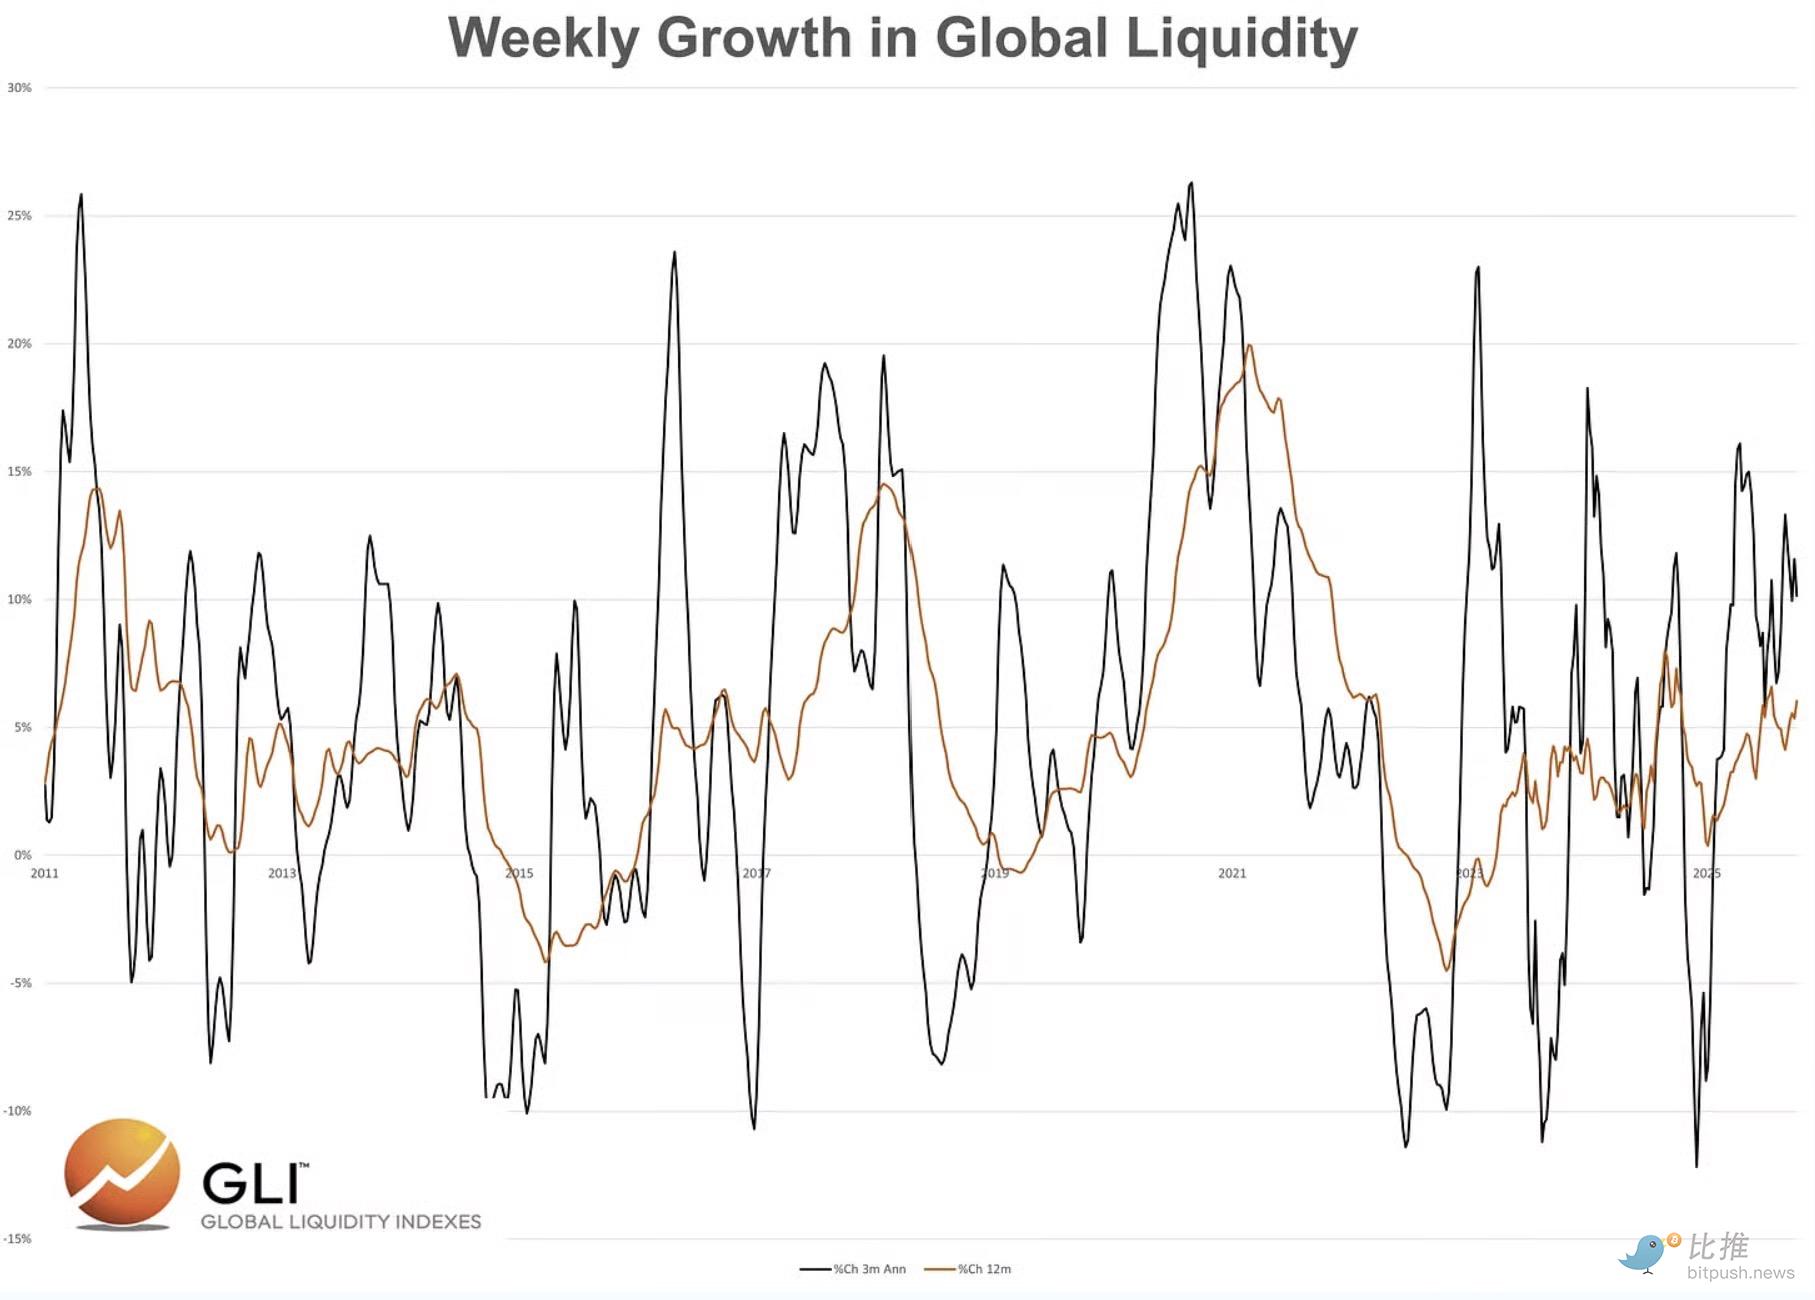
Data source: Global Liquidity Indexes
-
The three-month annualized growth rate is currently 10.2%
-
The annual growth rate is currently 6%
Of course, doesn't this mean that Bitcoin should continue to rise, right?
Data/narrative would lead one to this conclusion. However, in the last two cycles, global liquidity continued to expand even after Bitcoin peaked...
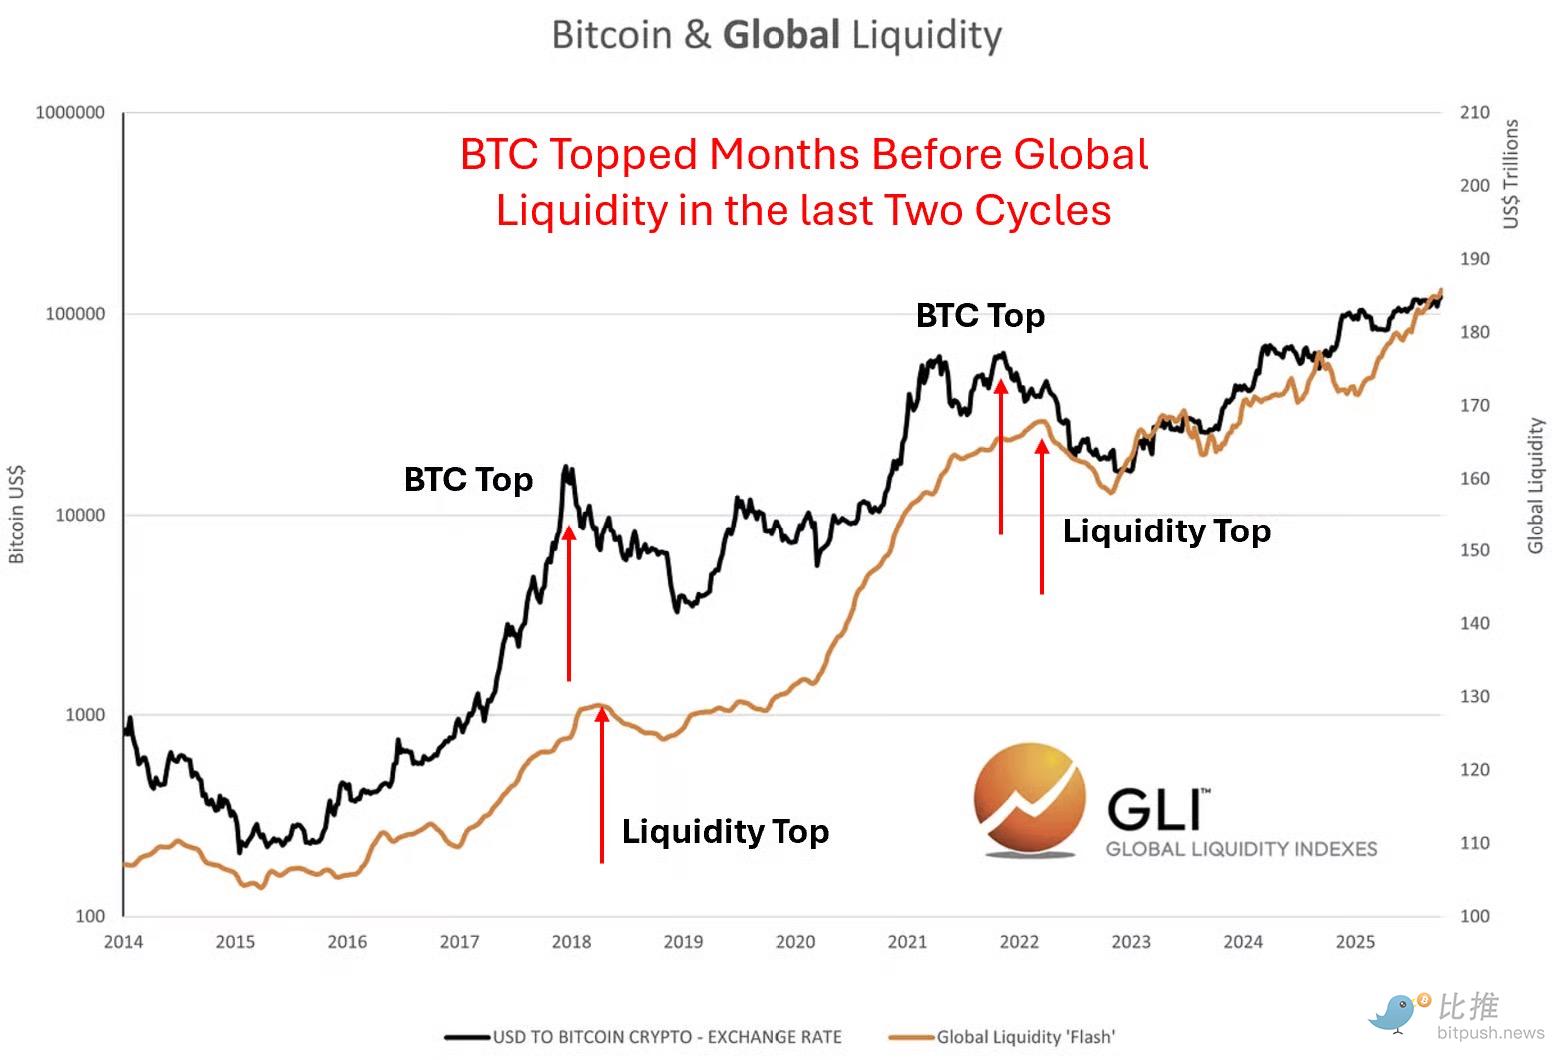
Data source: Global Liquidity Indexes
This contradicts the narrative we've all been told: that Bitcoin lags behind liquidity.
Let's pause here.
And simply ask this question: Why would Bitcoin lag behind liquidity conditions?
After all, markets are forward-looking. And given that Bitcoin prices information 24/7 in global markets, why would it lag behind key variables related to price that market participants understand?
On the contrary, we believe Bitcoin leads global liquidity—especially at market cycle tops.
Why?
We believe the market is preemptively responding to tightening liquidity conditions. It is sniffing out what will happen next.
But at market bottoms (bear markets), global liquidity often leads.
Why?
In bear markets, the market tends to wait for monetary and fiscal authorities to give the "all clear" signal.
Please note, we have not quantitatively proven this yet (we currently do not have the raw data). But we can illustrate our point by studying the charts.
Now. If we assume that global liquidity will once again continue to expand after Bitcoin peaks, then our task is to identify the catalyst that will cause global liquidity conditions to decline.
In the last cycle, the catalyst was inflation and the fact that the Federal Reserve had to raise rates quickly. This is why the market "preemptively reacted" in November 2021. In this case, liquidity contraction was driven by central banks (monetary policy).
What could be the catalyst today?
In this cycle, the tightening pressure may not come from the Federal Reserve (which is expected to cut rates in October and December), but rather from fiscal policy.
Expected Fiscal Impact: Tariffs + BBB Spending Cuts
1. Expected tariff revenue: $380 billion per year (assuming a tariff rate of 13%). Below we can see the impact so far.
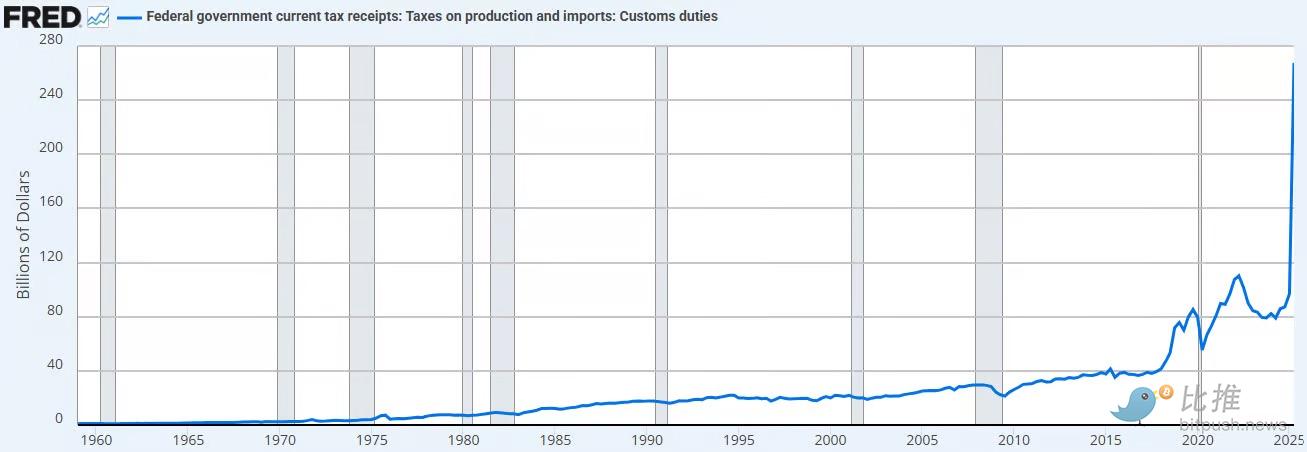
Data source: FRED
This is pulling liquidity out of the private sector (the economy) and back into the public sector coffers.
We believe this is deflationary, if not outright disinflationary.
2. Spending cuts. The Congressional Budget Office expects $1.2–1.3 trillions in spending cuts over the next decade (Medicaid reform, SNAP aid cuts, etc.).
This is equivalent to a possible $125 billion cut in spending per year.
When you add that to tariff revenue, we get a total fiscal tightening of $505 billion per year.
This is equivalent to 1.7% of GDP.
Now. We will also see effective corporate tax cuts in 2026. Tipping tax exemption. And $35 billion in new spending per year (infrastructure, defense, rural hospitals, NASA).
This may help offset the fiscal tightening from tariffs and spending cuts.
But is it enough?
If Bitcoin does indeed lead liquidity again at the top, we believe this is ultimately what it is "preemptively reacting" to.
Tightening of fiscal policy, which is negative for liquidity.
You will often hear Bassent mention this in interviews. "We want to stimulate the economy through the private sector."
We believe this will happen. But the road to achieving this may be messy. That's why we believe the Trump administration is firmly advocating for aggressive rate cuts (to "transition" to the new economy).
Banking Sector Liquidity
In addition to the brewing fiscal policy changes, we are also observing tightening liquidity in the banking sector.
Below, we can see the growing imbalance between dealer banks' liquidity and available collateral in overnight funding. This indicates an increasing shortage of money market liquidity as dealers scramble for cash or collateral.
This is consistent with the following:
-
Fiscal contraction
-
Ongoing quantitative tightening
-
Treasury General Account rebuilding
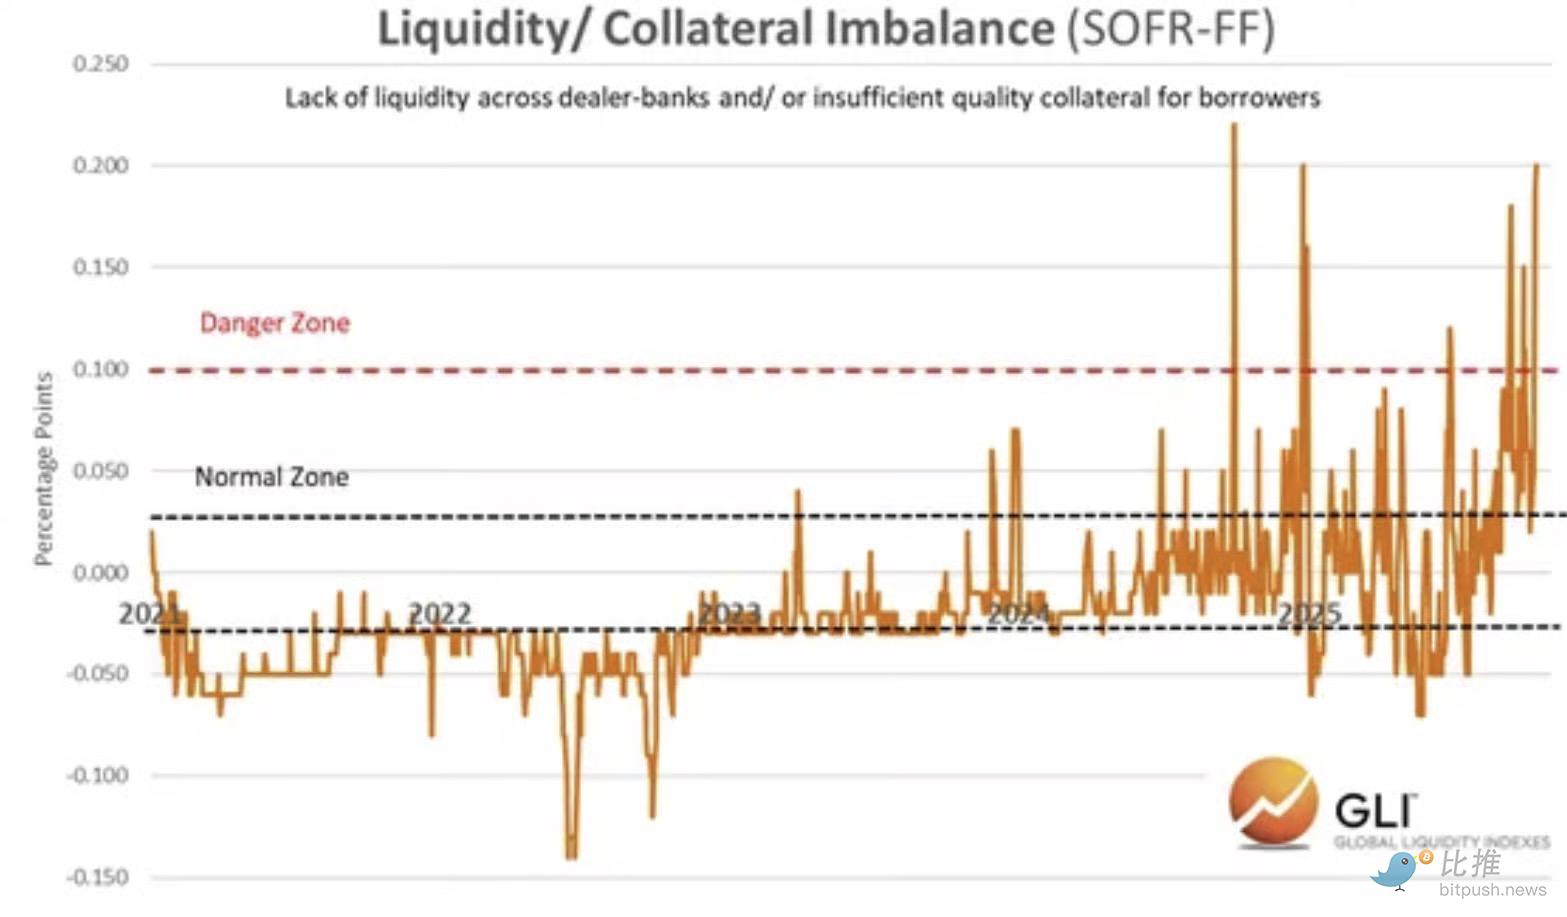
Data source: Global Liquidity Indexes
As this situation develops, bank reserves are approaching the Federal Reserve's "shortage level."
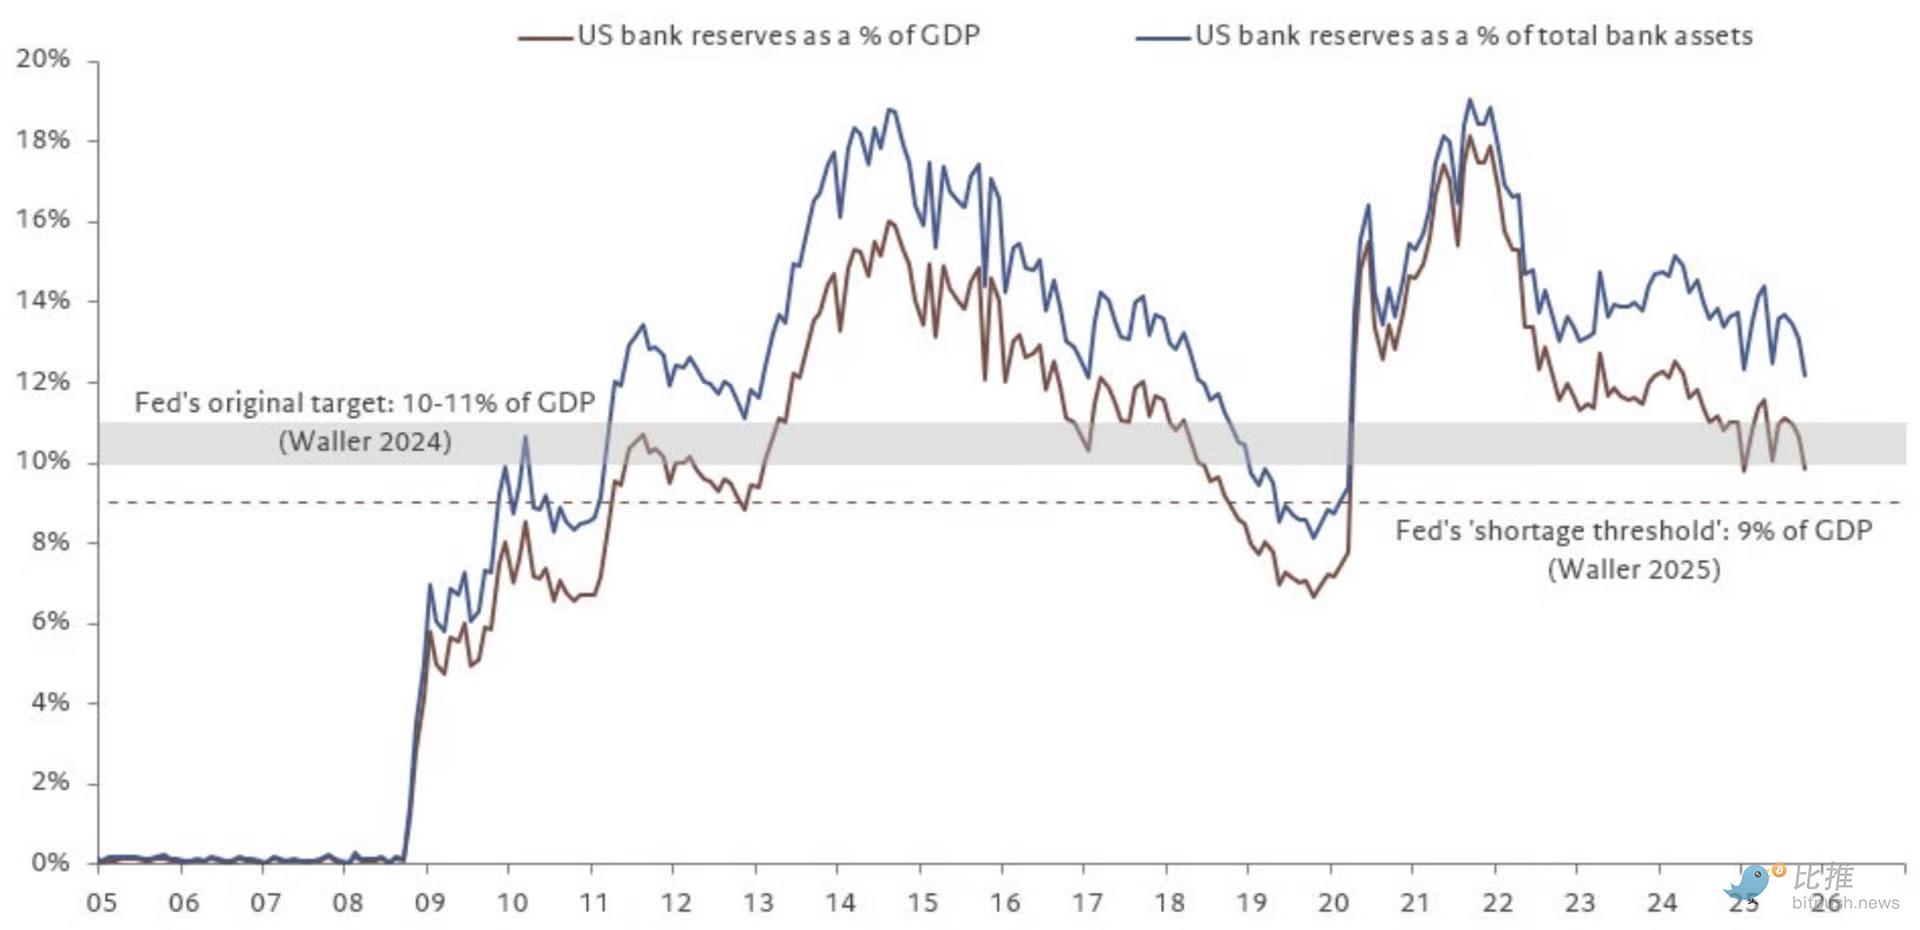
Data source: @fwred
In summary, it looks like trouble is brewing. The bond market seems to agree.
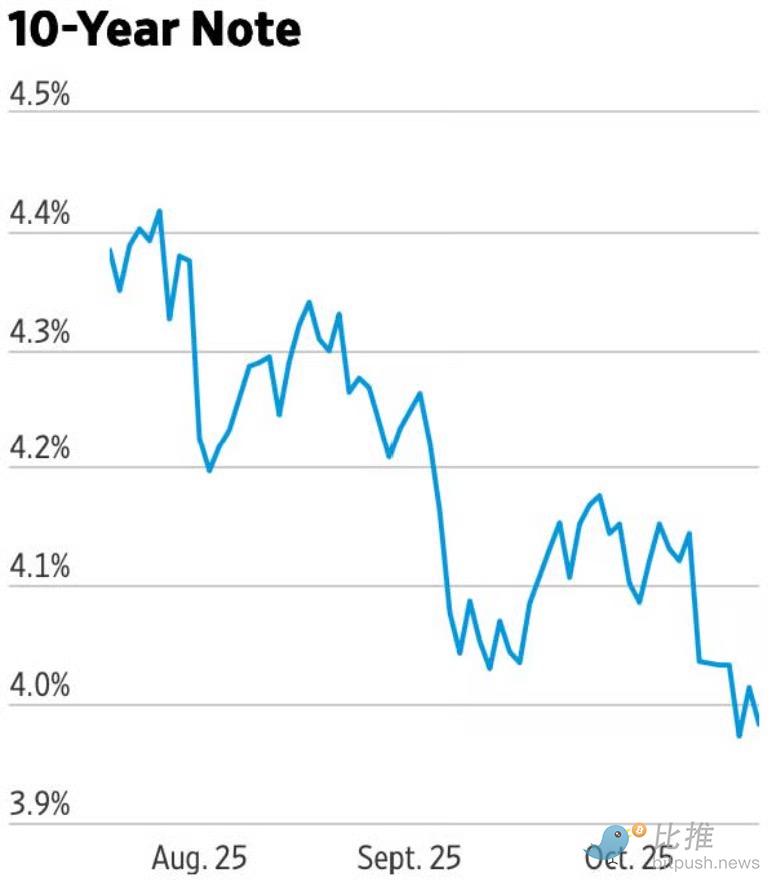
Final Thoughts
It is clear that Bitcoin "led" global liquidity at the tops of the previous two cycles. In the 2021 cycle, what Bitcoin sniffed out was inflation and rate hikes. At that time, the Biden administration was shifting the economy towards "fiscal dominance"—which drove Bitcoin's liquidity in this cycle.
What about today?
We are now shifting away from "fiscal dominance."
Our conclusion is that during the transition, this will have a negative impact on risk assets.
Disclaimer: The content of this article solely reflects the author's opinion and does not represent the platform in any capacity. This article is not intended to serve as a reference for making investment decisions.
You may also like
The script at the end of 2018: The Federal Reserve continued to raise interest rates, US stocks plunged 20% from the September highs, forcing the Federal Reserve to "pivot" in January.
Goldman Sachs' head of trading believes the current US stock market is repeating the scenario of late 2018, with monetary tightening and equity market pressure. The Goldman Sachs Financial Conditions Index has tightened by about 8 points in two weeks, reaching the highest level in a year. The selloff has broadened from tech stocks to defensive sectors. Gold and equities are declining simultaneously, possibly indicating investors are selling assets to raise cash, making gold a key indicator for observing liquidity stress.

Goldman Sachs Trader “Revisits the 2018 Playbook”: Still Clearly Remembers “On December 24th, Clients Asked Why the Market Dropped So Much—And I Had No Idea”
Brian Garrett pointed out that the current adjustment in the US stock market is similar to the sharp decline in Q4 2018: the S&P 500 has already experienced 42% of the corresponding drop, and the VIX is approaching its peak just before Christmas. If history repeats itself, the bottom of this cycle may appear in January next year. However, the credit market and Federal Reserve policy have yet to provide clear signals of a bottom.
Anthropic (ANT.US) nearly “broke issue price,” but Claude knocks on the doors of “the highest peak in mathematics”! 17 million lines of Lean code used to write a candidate proof for the Riemann Hypothesis
On November 20th, Eastern Time, on its second day of trading, Anthropic's intraday price dropped to a low of $83.05, just 5 cents above the offering price of $83, and finally closed at $88.91, a decline of 8.50%. On the same day, the company's mathematician Levant Alperg announced on his personal website that he and Claude had found a candidate proof for the Riemann hypothesis, which has puzzled the mathematics community for 167 years, and released about 17 million lines of Lean formalized code.

As US stocks plummet, the parent company of GTA 6 rises against the market! First-day sales hit a record $3.79 billion; Wall Street shifts focus to next-generation GTA Online.
According to Rentrak data, the global box office of "Grand Theft Auto VI" has also surpassed that of "Avengers: Endgame," the highest-grossing film of all time, which has a global box office of approximately $2.94 billion.

Crypto prices
More


