
XCN Price Could Mirror Past Fractal for 100% Rally If One Signal Holds

Onyxcoin’s (XCN) price has corrected 33% in three months, yet a familiar fractal pattern and fresh whale accumulation could set up the next rally — if one signal confirms.
Onyxcoin (XCN) is once again on traders’ radar. Currently trading near $0.0105, the XCN price has corrected more than 33% over the past three months, yet its year-on-year performance still sits above 700%.
That longer-term uptrend keeps traders revisiting the chart, and now a familiar technical setup is emerging — one that could hint at another rally, provided one key signal confirms.
Whales Step In Despite the Dip
While retail sentiment has cooled, whales have quietly accumulated. Since August 29, large wallets have added about 120 million XCN tokens, worth roughly $1.27 million at current prices. Notably, this buying came as prices slipped, suggesting whales are positioning early for a rebound.
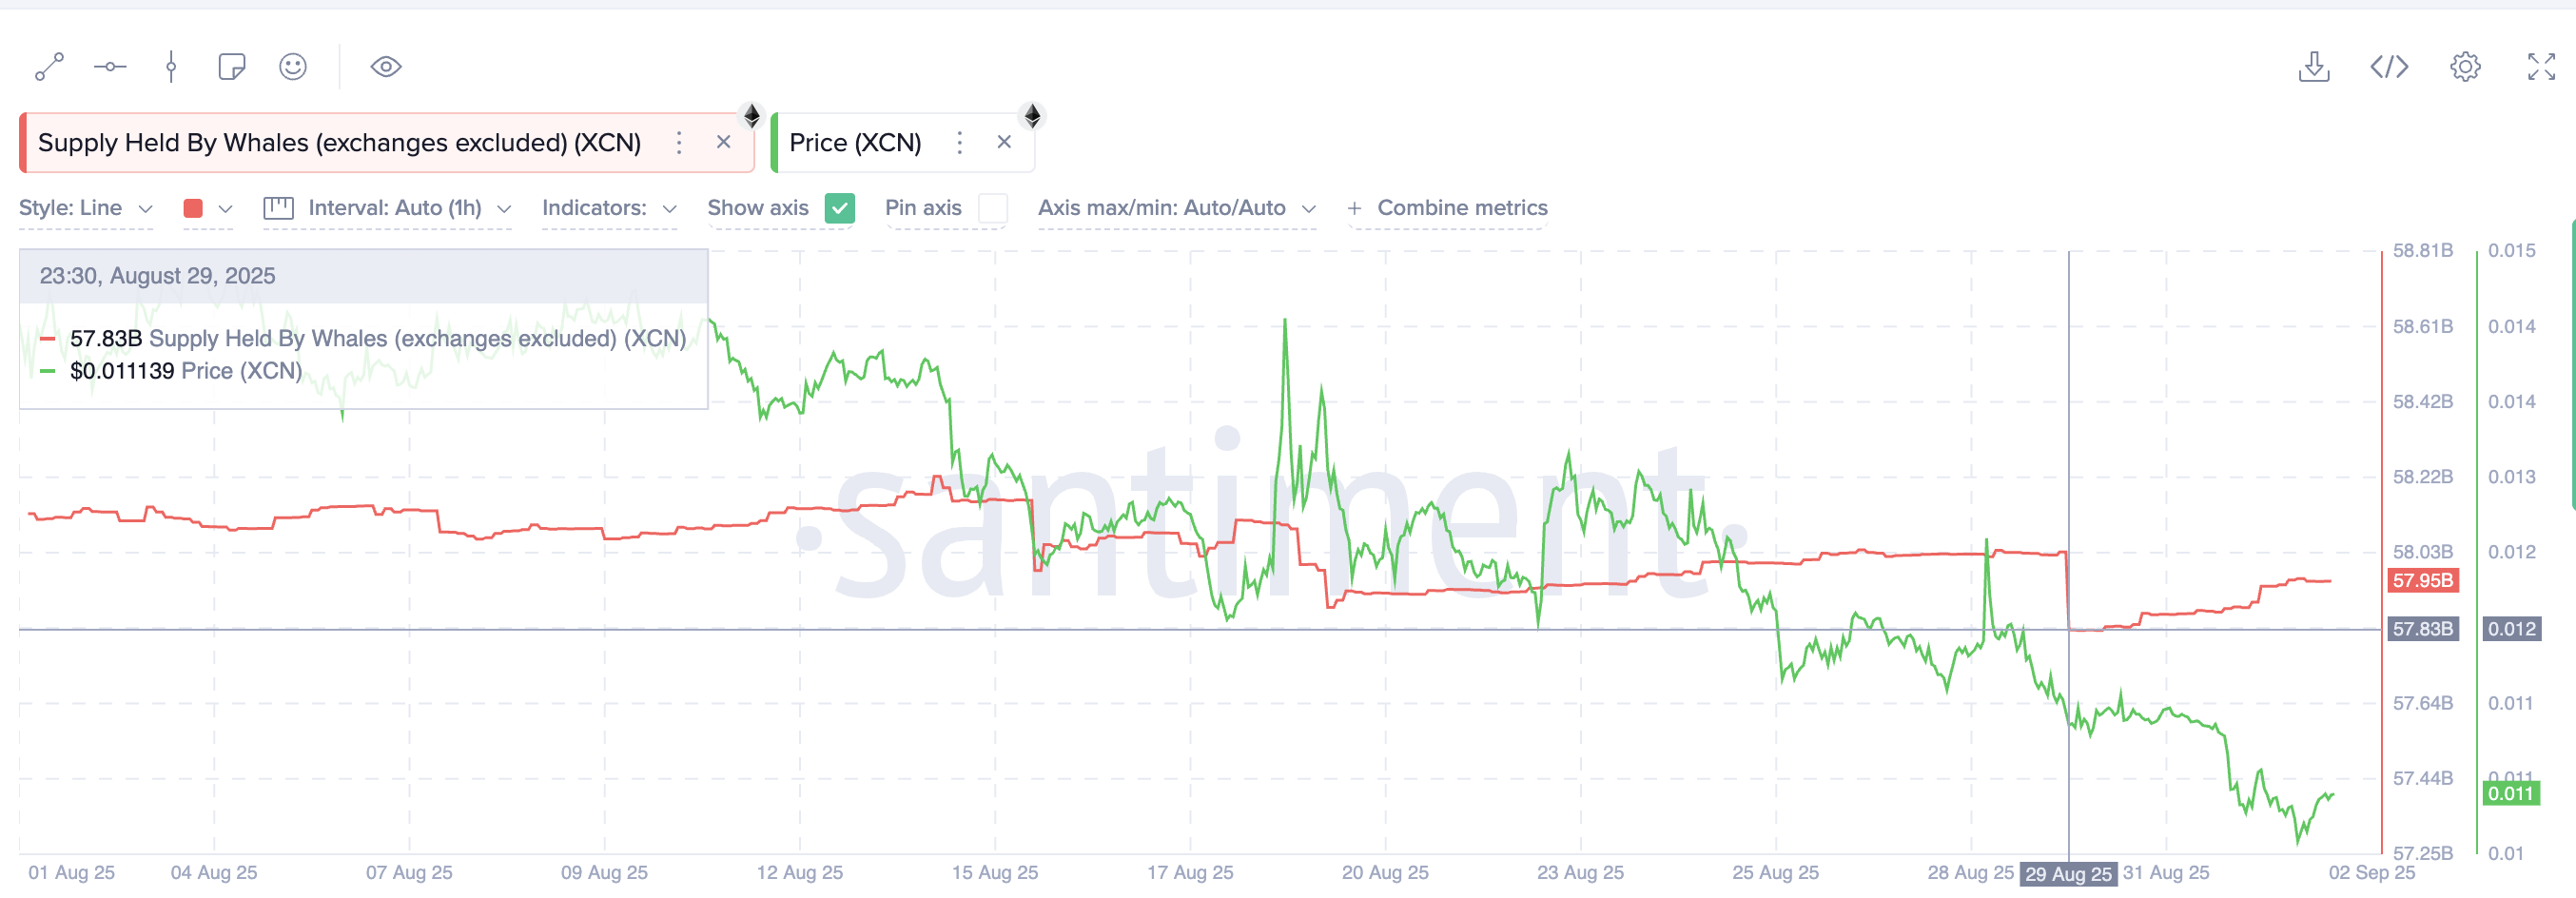 XCN Whales Buying The Dip:
This pattern of dip-buying has often preceded broader recoveries in crypto markets, as it signals confidence from the largest holders even when price action looks weak.
But what are whales seeing that others don’t? The mystery unfolds in the next section.
Want more token insights like this? Sign up for Editor Harsh Notariya’s Daily Crypto Newsletter here.
Fractals Show a Familiar Bullish Divergence and Possibility of a Rally
What excites traders most is a recurring technical pattern. A bullish divergence occurs when price makes a lower low while the Relative Strength Index (RSI) — which measures momentum — makes a higher low. This often signals that sellers are losing strength, even though prices keep dropping.
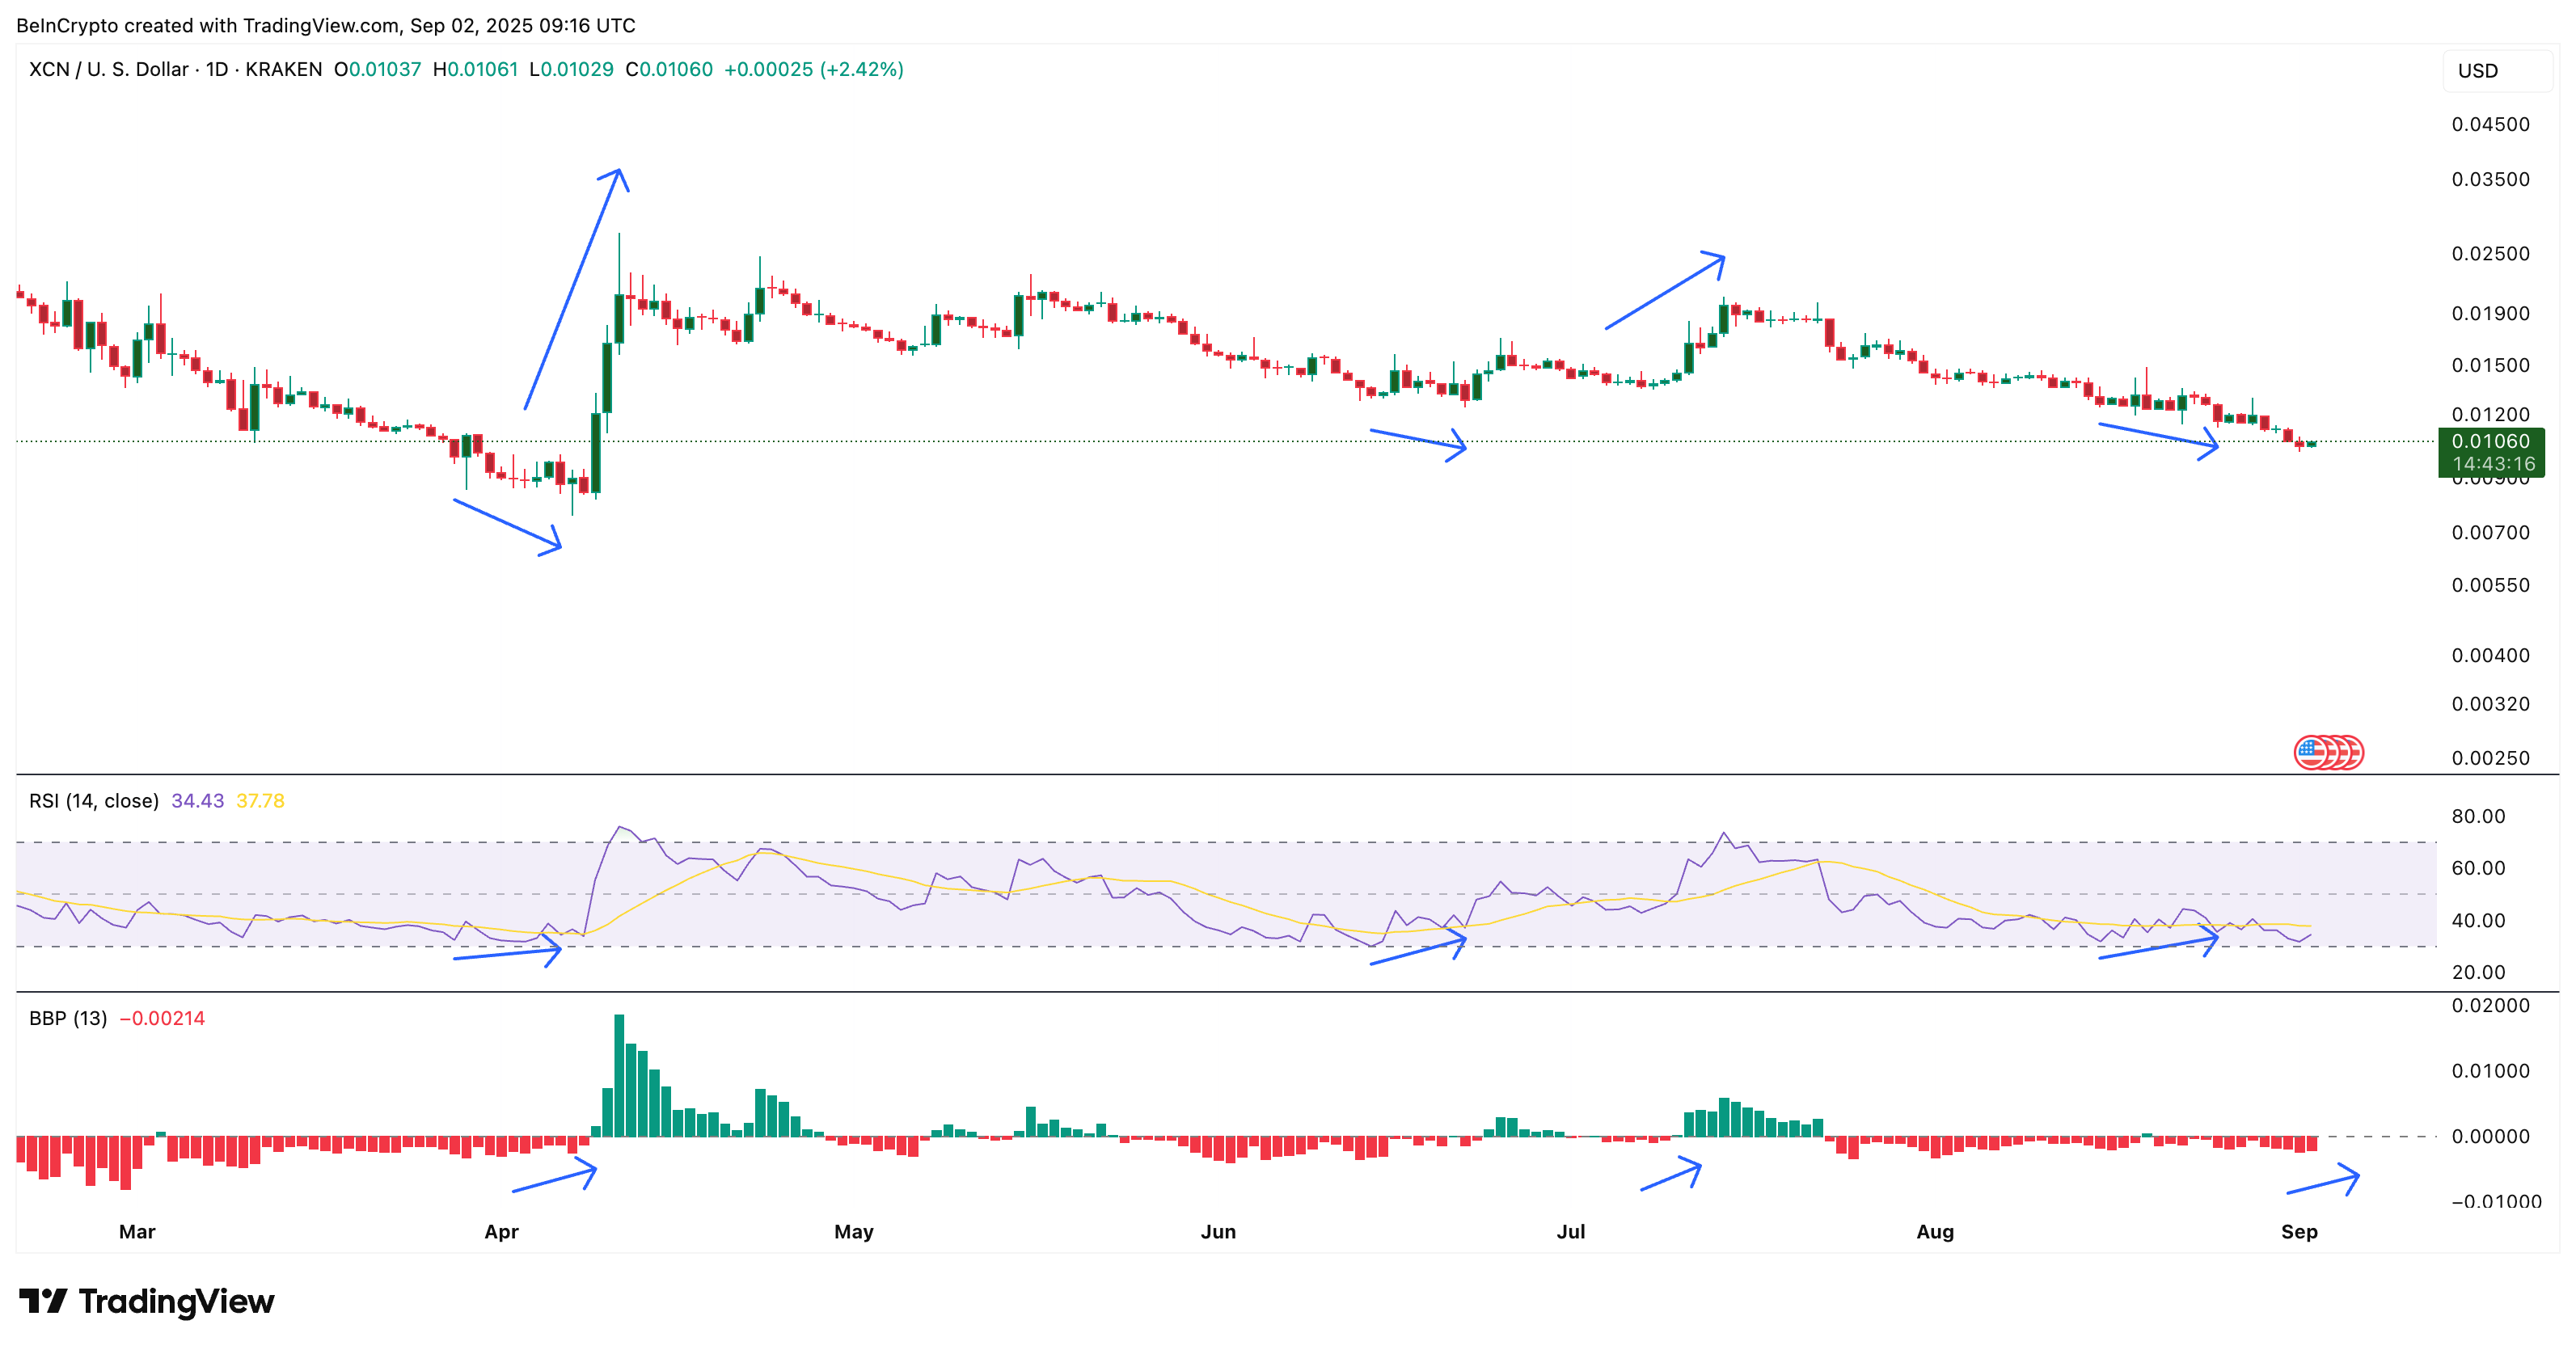 XCN Price Fractal:
The current XCN price might be experiencing something similar.
- March 28–April 6: Price hit new lows while RSI climbed. After a brief correction, XCN surged from $0.007 to $0.027, nearly a 285% rally.
- June 14–22: A similar divergence appeared. Following consolidation, the XCN price doubled from $0.01 to $0.02.
Now, between August 15–25, the same divergence has formed again. Prices corrected after, but if history repeats, another 100% move (at least) may be in play. One caveat: in both prior cases, the rally was delayed until buyers fully took control, highlighted by the Bull-Bear Power indicator flipping green. That’s the signal traders would be eyeing for now.
This means that the XCN price may not trigger immediately.
XCN Price Levels to Watch
The chart has trended lower since July, so Fibonacci retracement levels from the July peak are guiding key levels. At present, holding above $0.010 is crucial. Losing that would expose supports near $0.0093 and even $0.0075.
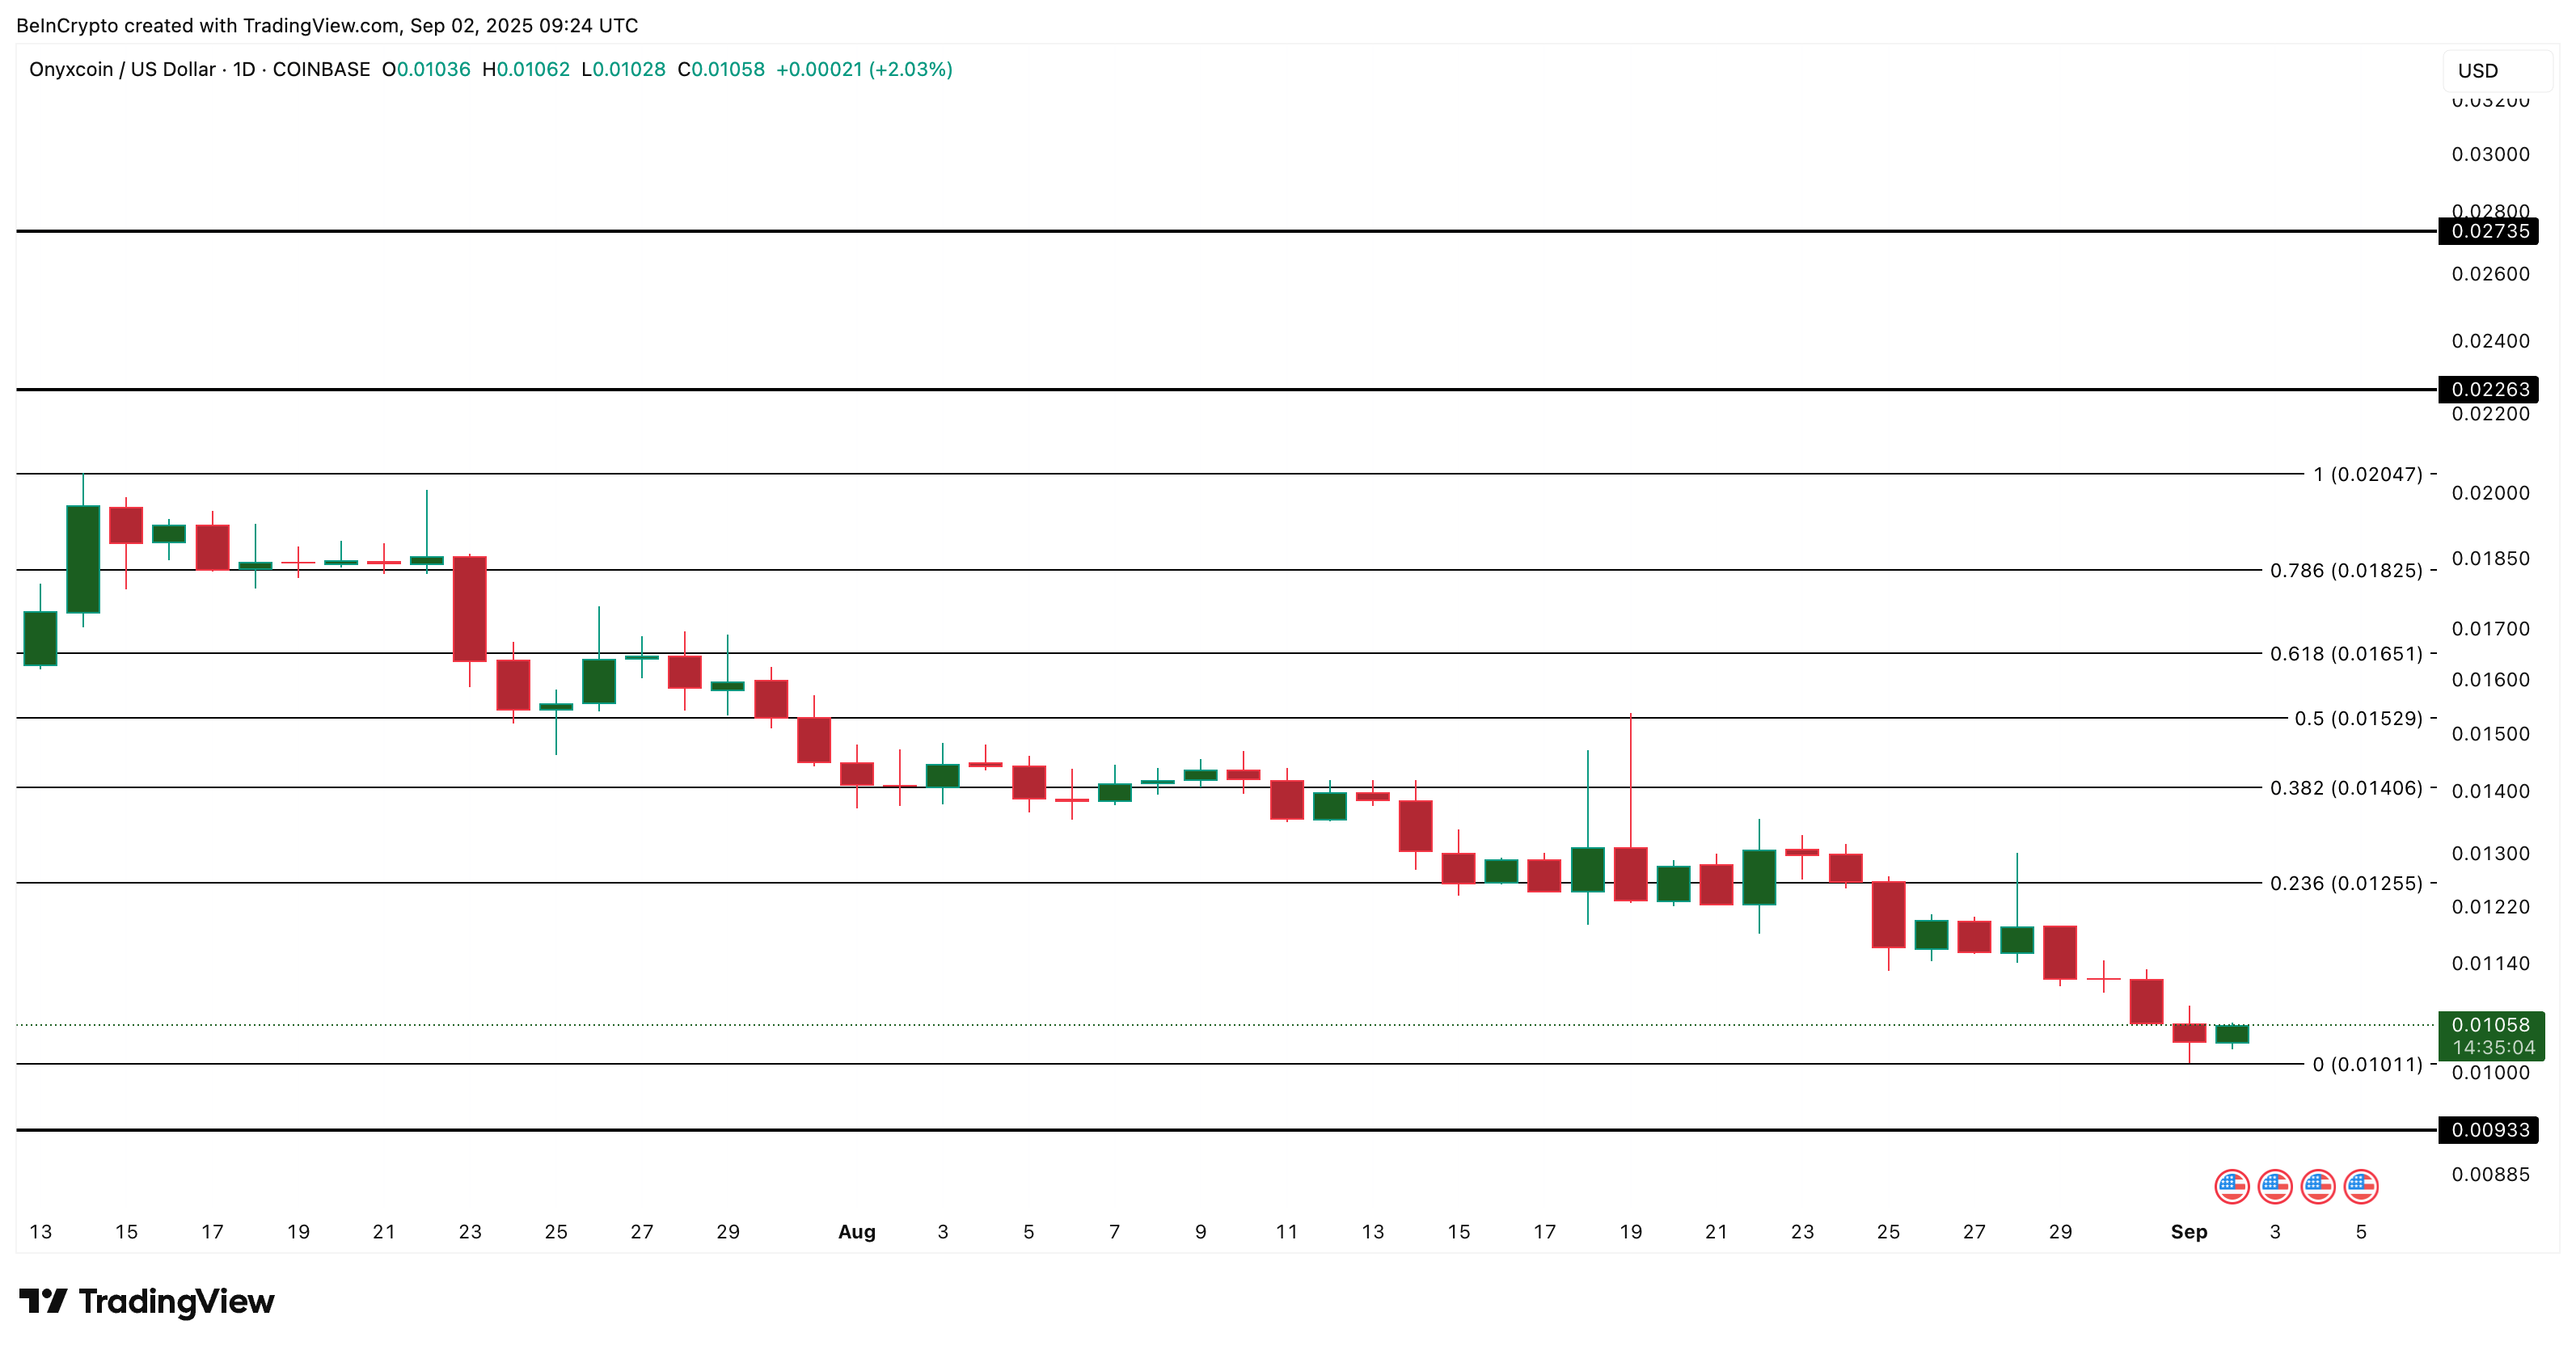 XCN Price Analysis:
On the upside, the first resistance for the XCN price lies at $0.0125. Clearing it would open the way toward $0.02, a level tested in past rallies. If bulls manage to push above $0.02, the next target stands at $0.027, echoing even March’s rally.
In short, whale accumulation plus a recurring divergence gives the XCN price a bullish setup, but confirmation is needed. Unless buyers reclaim momentum on the daily chart, the fractal will remain just potential — not confirmed. And losing $0.009 can even invalidate the same.
Disclaimer: The content of this article solely reflects the author's opinion and does not represent the platform in any capacity. This article is not intended to serve as a reference for making investment decisions.
You may also like
Federal Reserve raises interest rates for the first time in three years! Waller sends a hawkish signal, another 25 basis point hike possible this year
The Federal Reserve raised its benchmark interest rate by 25 basis points to a range of 3.75%-4.00% on Wednesday, marking the first rate hike since July 2023.

The yield approaching 5% is not due to market doubts about the Federal Reserve; Walsh: The main drivers are the strong US economy, AI capital expenditure, and geopolitical risks.
Federal Reserve Chairman Waller stated on Wednesday that the recent sustained rise in U.S. long-term Treasury yields does not mean investors are losing confidence in the Fed's ability to control inflation.

Gold and silver prices rise: oil prices fall ahead of the Federal Reserve decision

Japan’s Foreign Exchange Intervention “Drains Liquidity”? Overseas Holdings of US Treasuries in July Fall to Nine-Month Low, China’s Holdings Hit Lowest Level Since 2008
According to a report from the U.S. Department of the Treasury, overseas holdings of U.S. Treasury bonds in July decreased by $50.4 billion compared to the previous month. Japan, the top holder of U.S. debt, reduced its holdings by $12.8 billion, marking a third consecutive monthly decline and reaching a new low not seen for over a year. China, the third-largest holder, cut its U.S. debt holdings by $15.4 billion, marking a second consecutive monthly decrease. The United Kingdom, the second-largest holder, bucked the trend by increasing its holdings by $58.4 billion, reaching a new record high previously set in May. France and Canada saw the largest reductions in holdings in July, decreasing by $41.5 billion and $30 billion, respectively.
Crypto prices
More


