Ceva Stock Falls 10% Despite Revenue Beat — $31.09 Level Now Decisive
Ceva Stock just delivered a session that resets the entire technical picture. The daily candle opened at $36.84 and hit its high at the open. It then collapsed to a $31.80 low before closing at $31.92. That is a full-range liquidation bar. The burden of proof now sits firmly with the buyers.
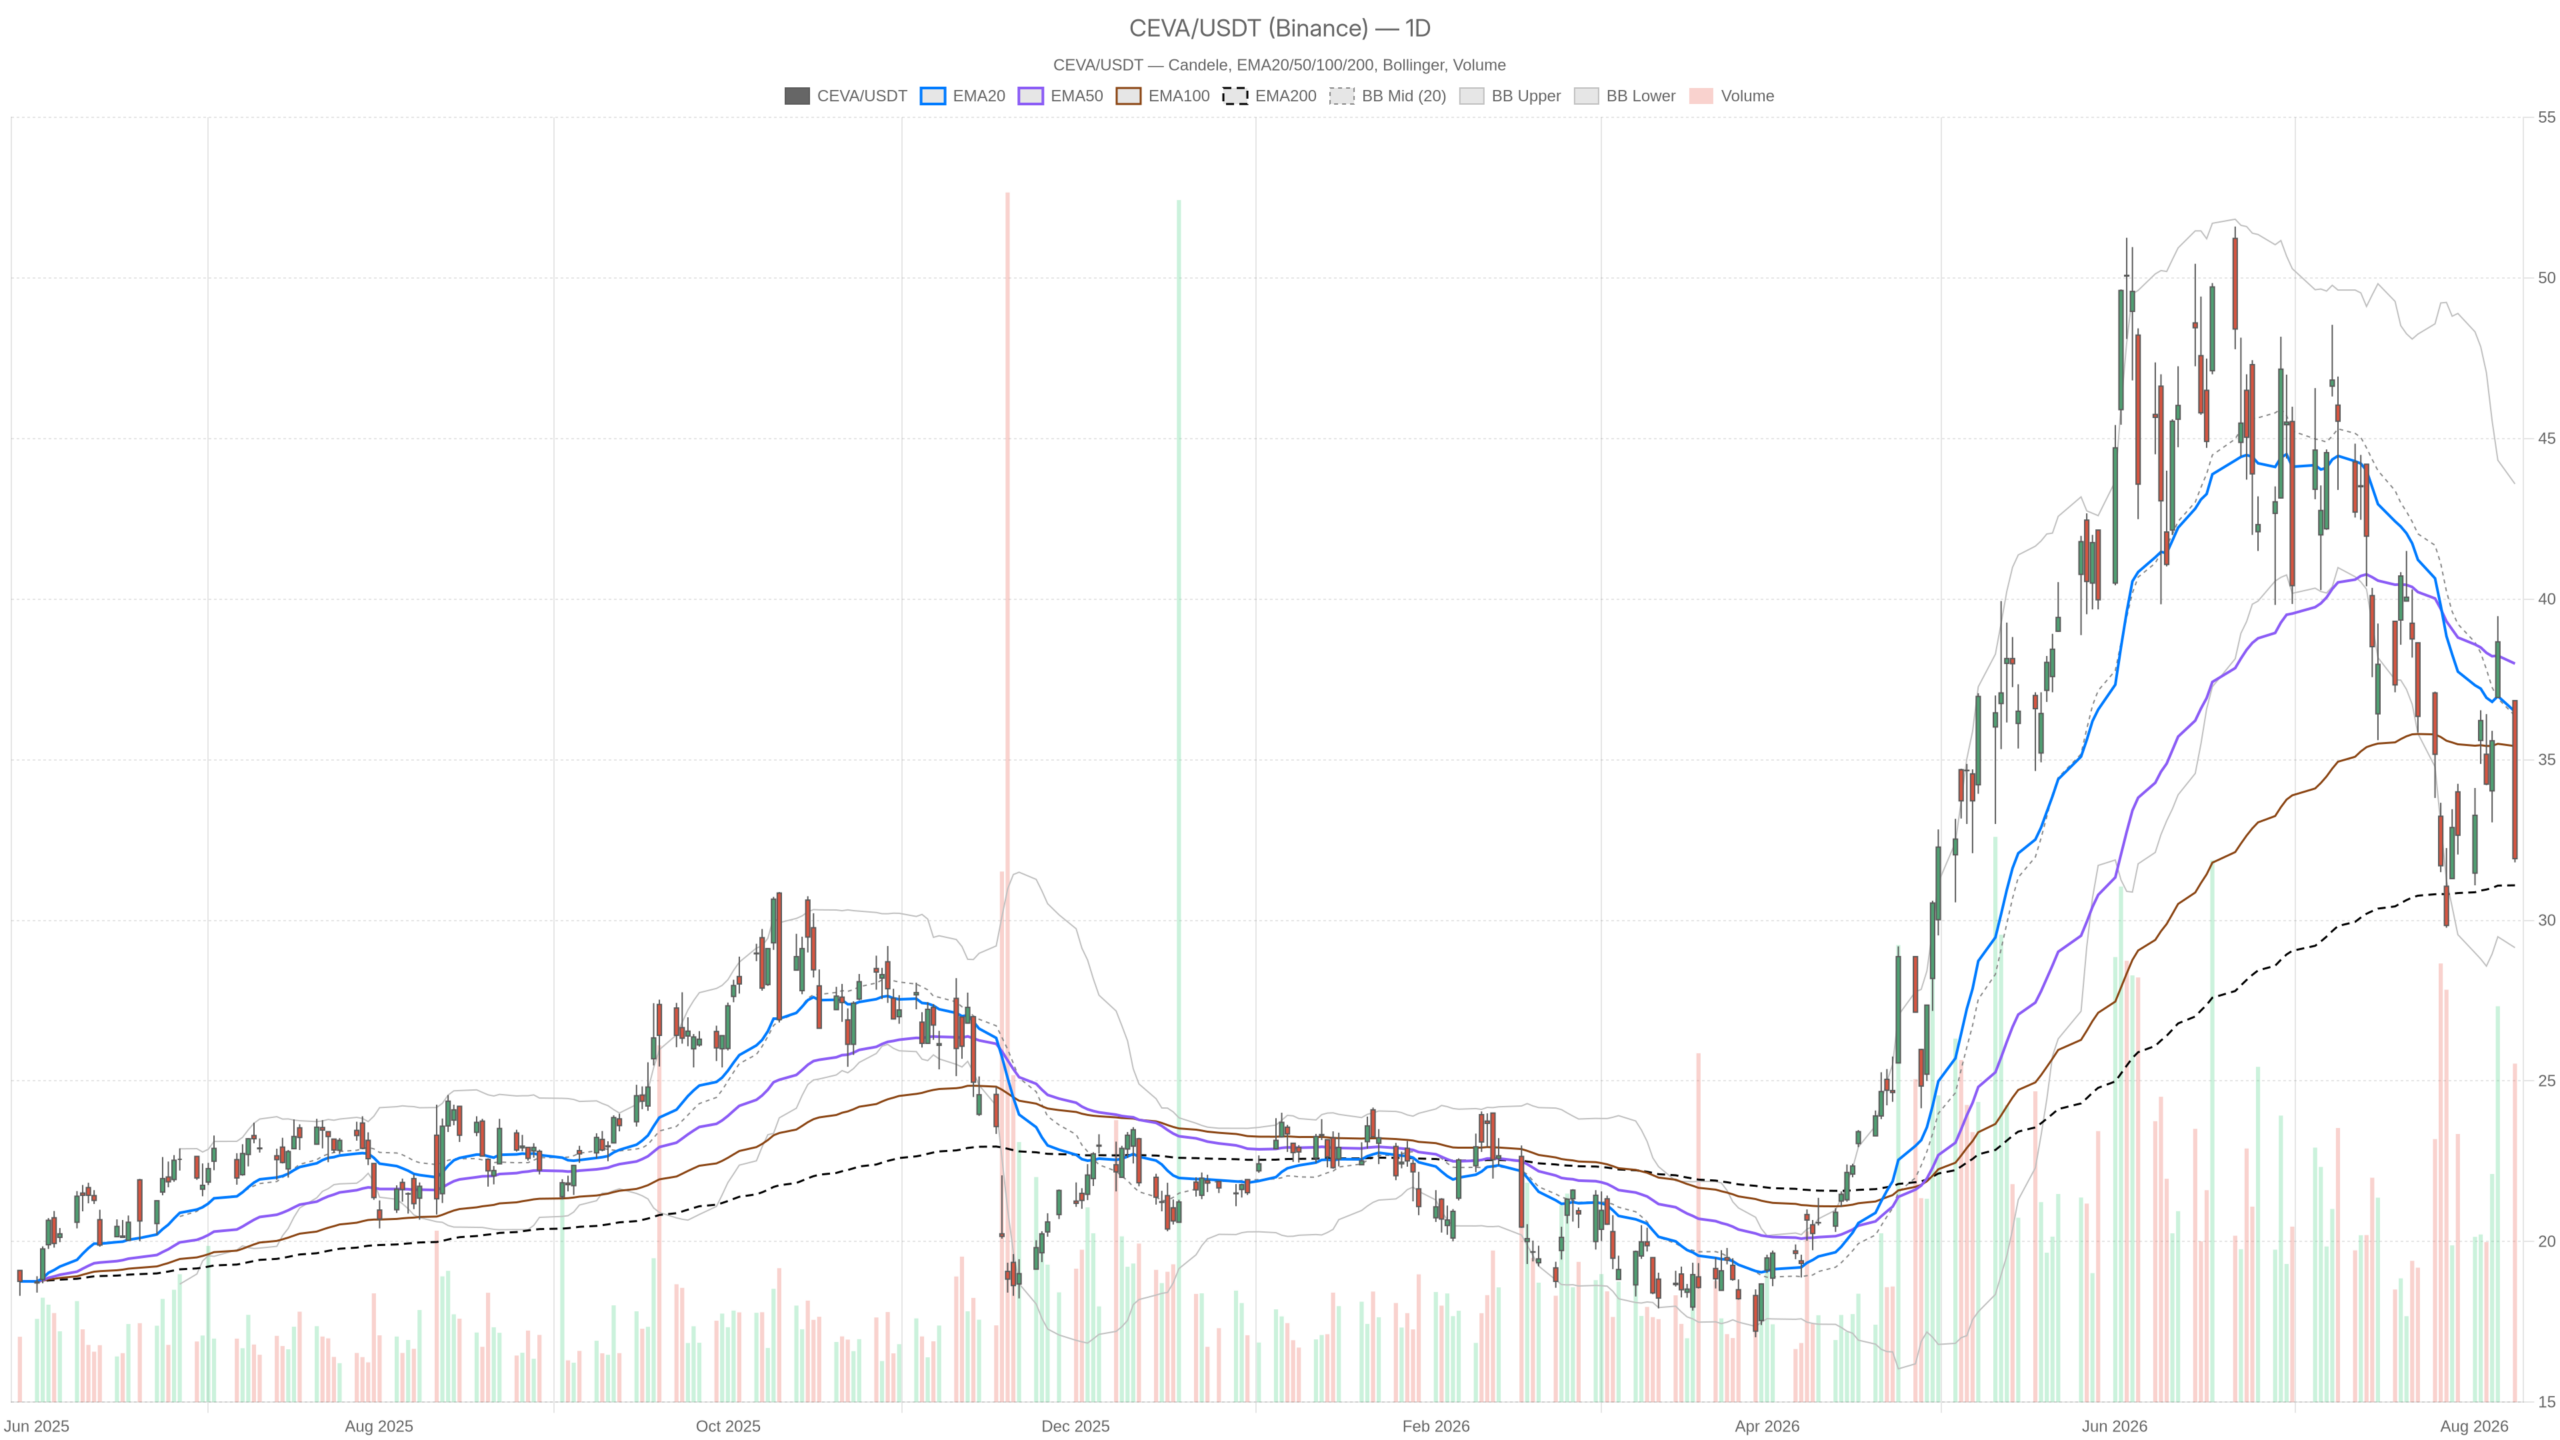 CEVA — daily chart with candlesticks, EMA20/EMA50 and volume.
 Summary
- Key takeaways
- Daily structure: Ceva Stock shifts to a neutral-to-weak regime
- Pivot map and key levels for Ceva Stock
- 1H chart: Ceva Stock confirms bearish alignment
- 15-minute chart: Ceva Stock is stretched but not reversing
- Bullish scenario for Ceva Stock: the 200-day defence
- Bearish scenario for Ceva Stock: breakdown risk below $31.09
- Positioning and trading view for Ceva Stock
- FAQ
Key takeaways
- CEVA reported Q2 revenue of $29 million, up 13% year over year, yet shares fell roughly 10%
- Price closed at $31.92, well below the 20-day EMA at $36.50 and the 50-day EMA at $37.99
- The 200-day EMA at $31.09 is now the single most important support reference on the chart
- Hourly MACD shows fresh acceleration to the downside, undermining the neutral daily reading
- A decisive break below $31.09 opens the door to the daily S1 at $30.20 and the daily lower Bollinger band at $29.15
The fundamental backdrop makes the move more interesting. CEVA’s second-quarter revenue reached $29 million, up 13% year over year and 7% sequentially. Licensing activity hit its strongest level in three years. Royalty revenue also recovered from the prior quarter. CEO Amir Panush highlighted licensing and related revenue as the growth driver. The company beat estimates. The shares fell roughly 10% anyway.
That combination — good numbers, bad tape — usually says more about positioning than about the business. Expectations were elevated into the print. The market chose to sell strength rather than pay up for it.
Daily structure: Ceva Stock shifts to a neutral-to-weak regime
The daily chart now reads as neutral rather than outright bearish, yet the price action is clearly defensive. Ceva Stock at $31.92 sits well below the 20-day EMA at $36.50 and the 50-day EMA at $37.99. Short and medium-term trend structure has therefore turned against the stock. Meanwhile, the 200-day EMA at $31.09 is only marginally below the close. That line is now the most important reference on the chart.
RSI on the daily reads 40.99. Weak, but not broken. There is no oversold condition to lean on yet. This leaves room for further downside before any mechanical exhaustion signal appears.
The MACD, however, adds nuance. The line sits at -2.01 against a signal at -2.14, producing a small positive histogram of 0.12. Momentum is negative in absolute terms. Yet the rate of deterioration had been easing before this candle. That divergence — fading momentum decline against a violent price drop — is the core conflict in the daily picture.
Meanwhile, Bollinger Bands frame the damage. The midline sits at $36.37, the upper band at $43.59, and the lower band at $29.15. Price travelled from the middle toward the lower boundary in a single session without tagging it. There is still roughly a point of band space beneath the market. The move is stretched but not yet statistically extreme on the daily.
At the same time, volatility is the other headline. Daily ATR at 3.14 against a $31.92 close means average daily movement of nearly 10% of price. Any position sizing built on pre-earnings volatility is now obsolete.
Pivot map and key levels for Ceva Stock
The most important takeaway is that S1 at $30.20 and the 200-day EMA at $31.09 form a tight confluence zone. This is where buyers must step in. Daily pivots give a clean framework. The pivot point sits at $33.52, R1 at $35.24, and S1 at $30.20. Price closed below the pivot, keeping short-term structure heavy.
Above the market, $33.52 is the first genuine hurdle. Reclaiming it would neutralise the sell-off. Only a push toward $35.24 and the $36.37 Bollinger midline would suggest the earnings reaction was an overshoot rather than a trend change.
1H chart: Ceva Stock confirms bearish alignment
The hourly timeframe offers no relief. Its regime is bearish, and the moving average stack confirms it. The 20-hour EMA at $34.81 sits below the 50-hour at $35.03. Both sit far beneath the 200-hour at $37.84. Price at $31.88 trades well under all three. That is textbook trend alignment to the downside.
Hourly RSI at 33.68 shows persistent selling pressure without a true washout. More importantly, the hourly MACD is deteriorating fast: line at -0.71 versus signal at -0.03, with a histogram of -0.67. In contrast to the daily, where momentum decline was flattening, the hourly shows fresh acceleration lower. This weakens the neutral daily reading considerably.
At the same time, hourly Bollinger levels place the lower band at $30.84, with the midline up at $35.62. Price presses the lower band without breaking it. Hourly ATR of 1.36 confirms that intraday swings have widened sharply. Hourly pivots are tight — 32.19 pivot, 32.55 R1, 31.51 S1. This tells you the market is compressed into a narrow decision zone right at the lows.
15-minute chart: Ceva Stock is stretched but not reversing
The 15-minute timeframe is deeply oversold yet shows no confirmed reversal signal. RSI at 26.89 sits in oversold territory. Price at $31.88 trades below the lower Bollinger band at $32.04. The 15-minute MACD shows a line at -0.85 against a -0.93 signal, giving a marginal positive histogram of 0.07. That is the first faint sign of downside momentum losing pace.
However, faint is the operative word. All three 15-minute EMAs — 33.24, 34.54 and 34.94 — sit above price in bearish order. ATR of 0.35 keeps intraday ranges manageable. The 15-minute pivot at $32.14 and R1 at $32.44 mark the immediate ceiling. Until price closes back above $32.14, any bounce attempt remains a reflex within a downtrend.
Bullish scenario for Ceva Stock: the 200-day defence
The constructive case hinges on the 200-day EMA at $31.09 holding as support. Fundamentals give that argument substance. Revenue of $29 million with 13% annual growth, three-year highs in licensing, and recovering royalties do not describe a deteriorating business. If the sell-off was purely positioning-driven, the confluence zone between $30.20 and $31.09 is the logical place for it to end.
Notably, confirmation would need to be sequential. First, a reclaim of the 15-minute pivot at $32.14 and hourly pivot at $32.19. Then a close back above the hourly lower band area and the $32.55 hourly R1. Finally, a daily push through $33.52 toward the $35.24–$36.37 zone. The flattening daily MACD histogram and the improving 15-minute momentum are the early tells worth tracking.
Bearish scenario for Ceva Stock: breakdown risk below $31.09
The bearish path is simpler and currently better supported. A decisive daily close below $31.09 would break the last major trend support. It would open the door to the daily S1 at $30.20. Below that, the lower daily Bollinger band at $29.15 becomes the next reference. With daily ATR at $3.14, that distance can be covered quickly.
What invalidates the bullish case? Any failure to reclaim $32.19 on the hourly, combined with the hourly MACD staying deeply negative. Rejection at the $33.52 daily pivot would also confirm that sellers remain in control of rallies. Meanwhile, daily RSI at 40.99 has ample room to fall before signalling exhaustion.
Notably, headline flow adds an extra layer of noise. Coverage of a cyberattack and data breach at shipping operator Ceva Logistics has circulated alongside the earnings story. The incident affects eight European warehouses. It has rippled through banks, retailers and Steam users. The name overlap is worth keeping in mind when reading sentiment around Ceva Stock. The semiconductor licensing business and the logistics operator are distinct entities.
Positioning and trading view for Ceva Stock
Overall, this is a market where the daily chart says neutral-to-weak and the lower timeframes say bearish. That is not a conflict to trade around lightly. It signals that the higher timeframe has not yet caught up with the intraday deterioration. The neutral daily regime is a legacy reading. The price action is not neutral.
Volatility is the dominant risk factor here. A daily ATR near 10% of price, following an earnings beat that produced a 10% decline, means normal stop distances are inadequate. Normal size is excessive. The $31.09 to $30.20 zone is the pivot for the entire thesis. Above it, the case for a fundamentally-supported stabilisation stays alive. Below it, structure gives way. The recent lows stop being support at all. Until that question resolves, patience is worth more than conviction.
FAQ
Why did Ceva Stock fall after beating earnings?
CEVA delivered Q2 revenue of $29 million, up 13% year over year, and beat estimates. Yet the shares dropped roughly 10%. This disconnect typically signals elevated expectations heading into the print. The market chose to sell into strength rather than reward the beat. The move was likely positioning-driven rather than a reflection of deteriorating business fundamentals.
What is the most critical support level for Ceva Stock right now?
The 200-day EMA at $31.09 is the most critical support. It forms a confluence zone with the daily S1 at $30.20. A decisive daily close below $31.09 would break the last major trend support, opening the door toward the lower Bollinger band at $29.15.
Is the sell-off in Ceva Stock a buying opportunity?
The bullish case rests on the 200-day EMA holding and fundamentals remaining intact. Revenue of $29 million with 13% growth is not a deteriorating picture. However, confirmation is needed. Buyers must first reclaim the hourly pivot at $32.19 and then push toward the daily pivot at $33.52. Without that, the bearish intraday structure remains dominant, and the daily RSI at 40.99 still has room to fall.
Article produced with the assistance of artificial intelligence and reviewed by the editorial team.






