XRP price prediction for October 25 stays bearish below its $1.28 CRT low, the level XRP needs to reclaim after dropping under it today.
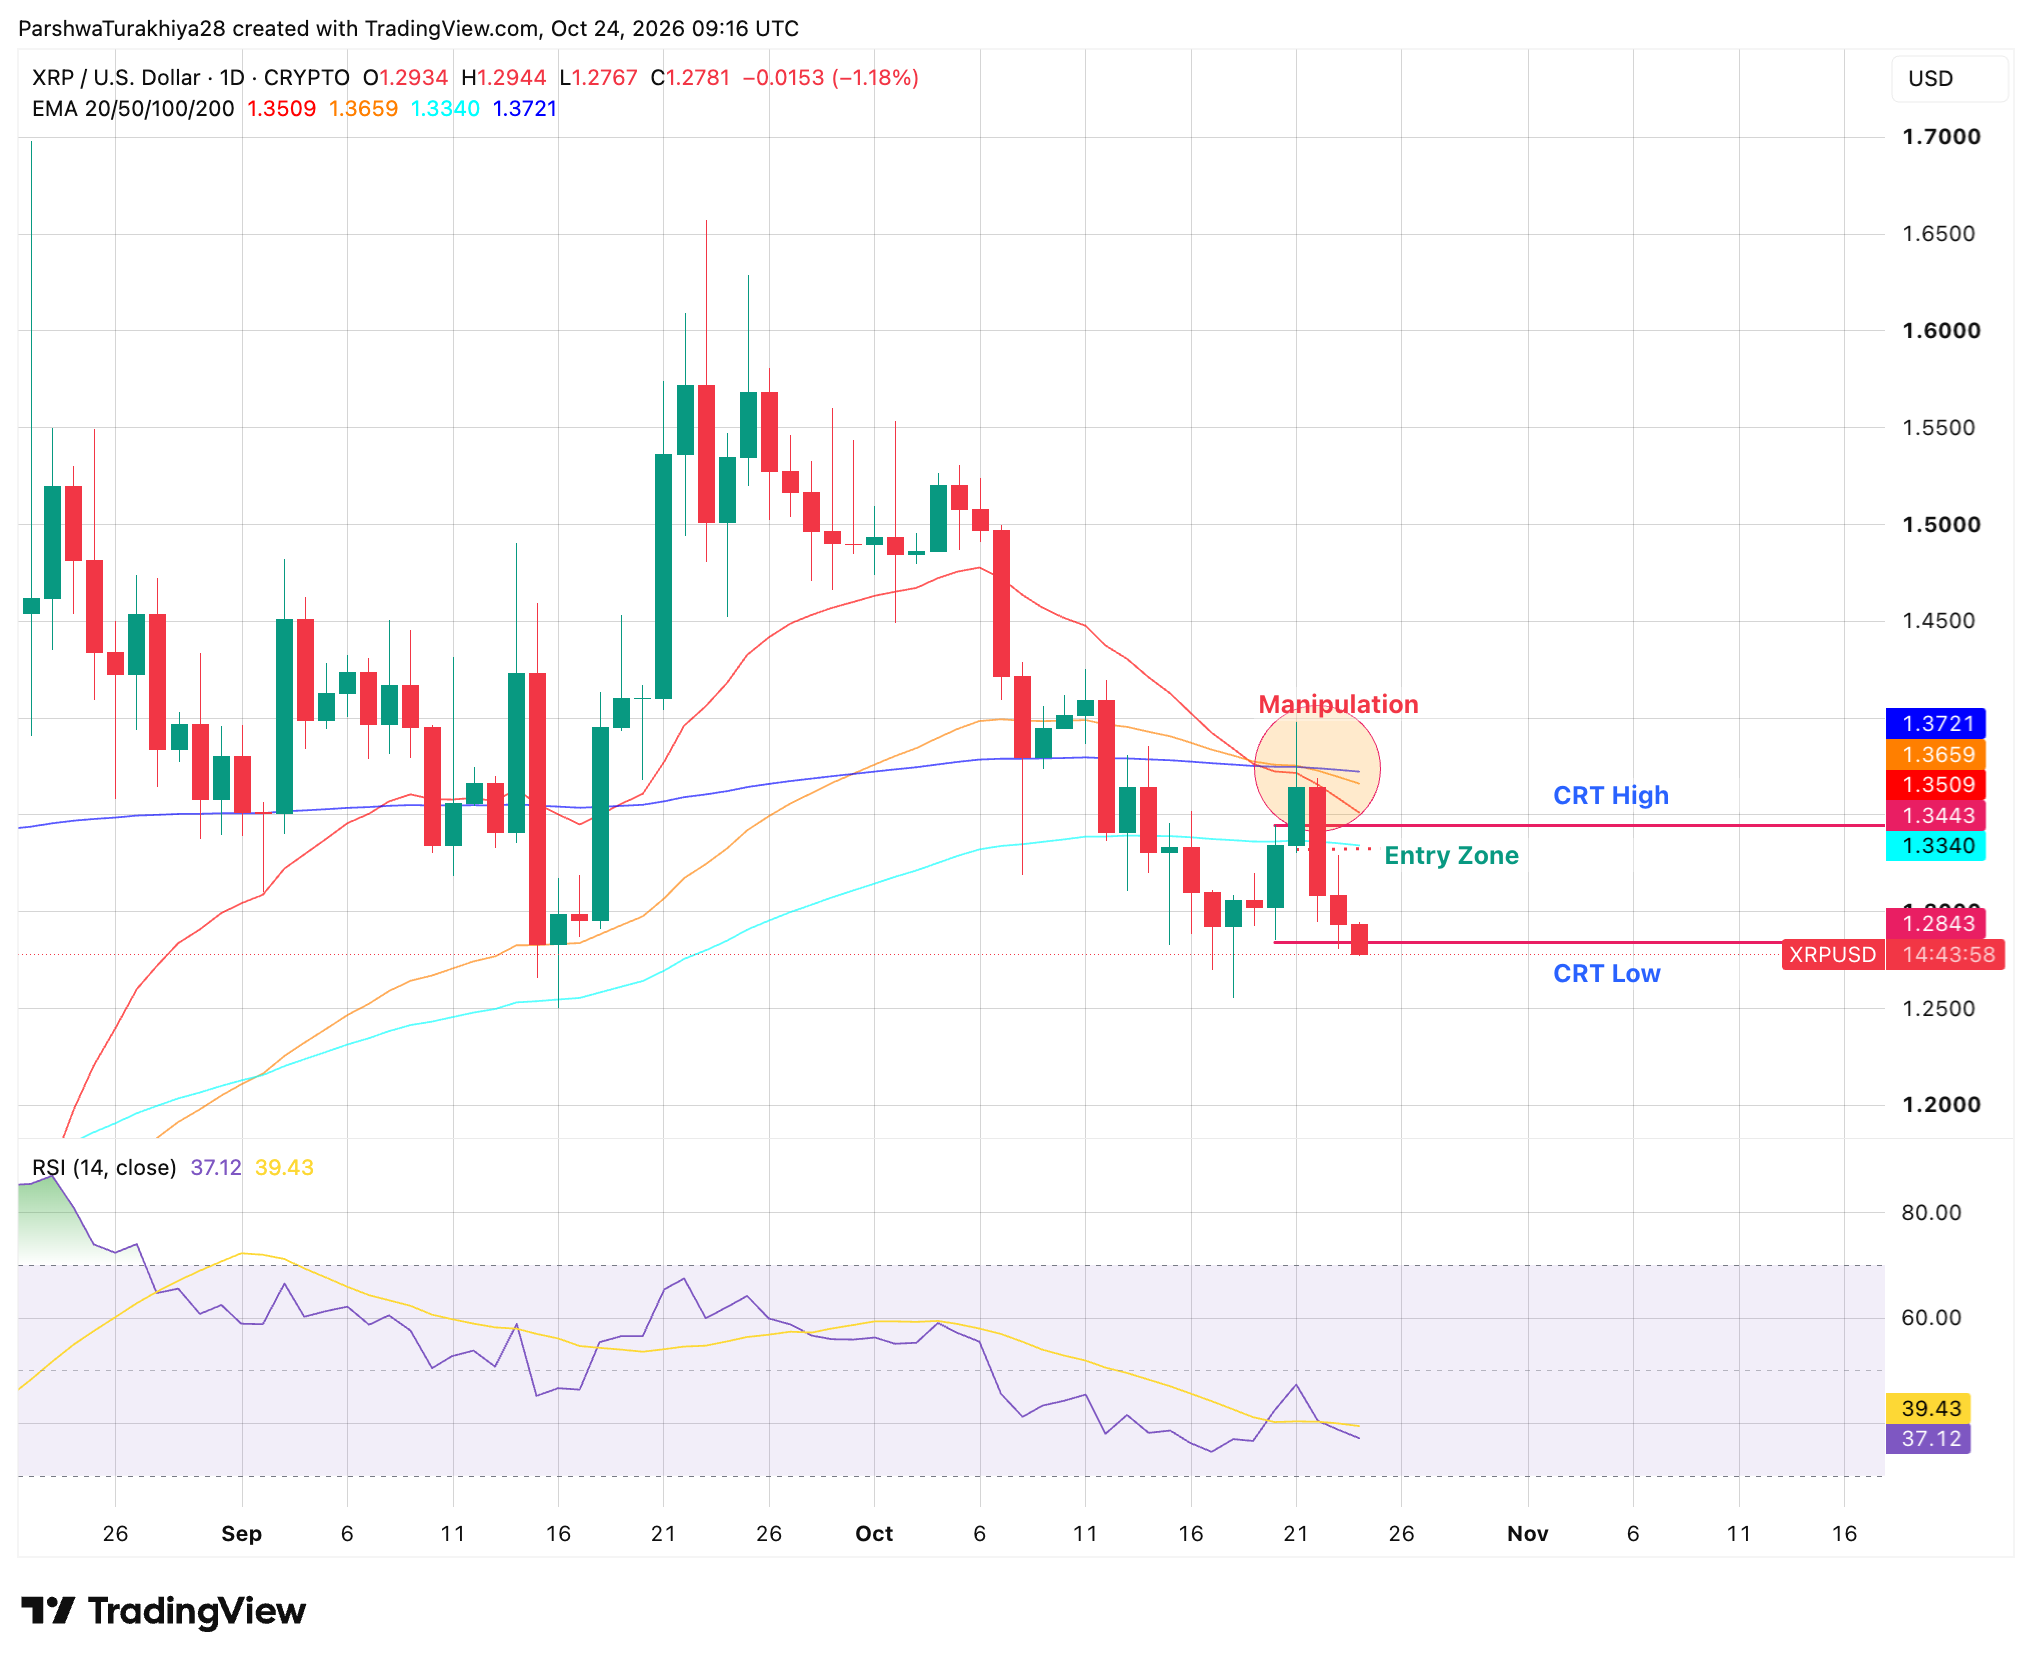
XRP is below its CRT low for now, trading about 0.5% under $1.28 and down 1.18% today, and only a close back above that level cancels the breakdown. CRT, or candle range theory, marks one candle’s high and low and watches for a sweep of one side followed by a move to the other. The range comes from the October 20 candle, between $1.34 and $1.28. XRP swept above the high on October 21 and closed back inside the range on October 22. Yesterday’s candle closed near $1.29, just above the low, and today’s drop through it is the move to the other side.
Price is also under all four daily EMAs, from the 100-day at $1.33 up to the 20-day at $1.35 and the 50-day and 200-day, both near $1.37. RSI at 37.12 is below its average of 39.43 and the neutral 50 mark, so momentum is still falling.
XRP looks more likely to close today below the CRT low and test $1.26 on Sunday, and a close back above $1.28 would put the 100-day EMA at $1.33 in play.
XRP Support and Resistance Levels, October 24, 2026
| Type | Price | Why it matters |
| Resistance | $1.28 | CRT low, now resistance |
| Resistance | $1.33 | 100-day EMA |
| Resistance | $1.34 | CRT high |
| Support | $1.26 | October 18 low |
| Support | $1.25 | Bottom of ChartNerd’s support floor |
| Support | $1.20 | Round level |
Over the last two months, price has also been boxed between the weekly 20 and 50 EMAs in a parallel channel, which was called normal compression after a 70% rally.
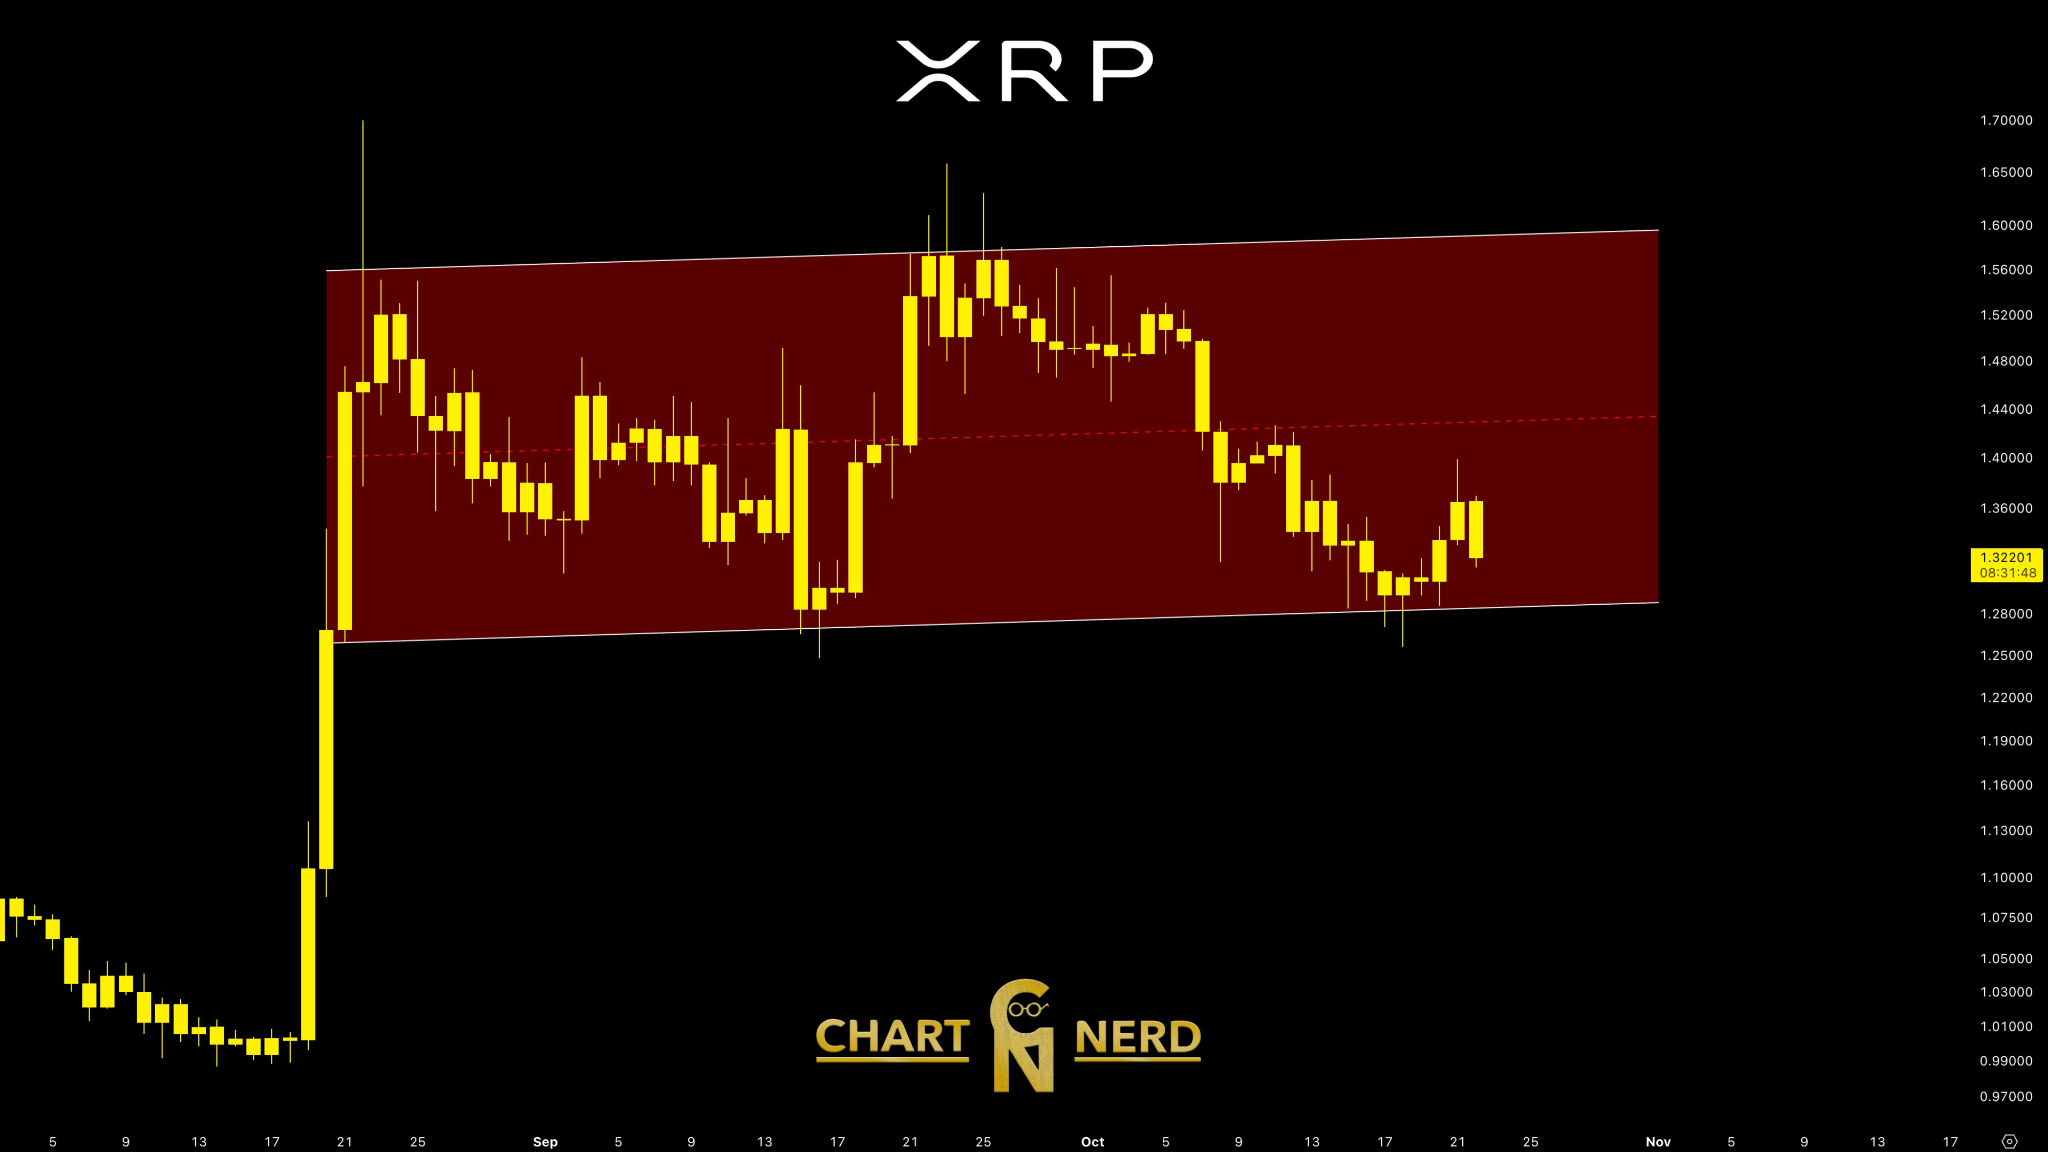
In his view, that structure, not the flow of positive news, is why price hasn’t followed developments. He is watching for a clean break of the ceiling to confirm continuation higher or a loss of the floor to confirm continuation lower, and stressed that confirmation matters. XRP now trades inside that floor zone, about 2% above its $1.25 base.
(adsbygoogle = window.adsbygoogle || []).push({});US spot XRP ETFs took in $4.25M for the week ending October 23. That follows a $1.84M outflow the week before, which ended 13 straight weeks of inflows. Friday itself recorded no flows, so the week’s gain came earlier. The inflow is well below the streak’s pace, which averaged about $24.80M a week.
| ETF Metric | Value |
| Weekly net flow, week ending Oct 23 | +$4.25M |
| Weekly net flow, week ending Oct 16 | -$1.84M |
| Weekly net flow, week ending Oct 9 | +$11.31M |
| Cumulative net inflow | $1.80B |
| Total net assets | $1.48B |
XRP closes today back above the $1.28 CRT low and holds it into Sunday, which would cancel the breakdown and put the 100-day EMA at $1.33 in play. A move through it would open the $1.34 CRT high, with the 20-day EMA at $1.35 just above. Continued ETF inflows would fit this path.
XRP closes today below $1.28 and slides toward $1.26, the October 18 low, on Sunday. A close below $1.25 would break the support floor ChartNerd is watching and put the round $1.20 level in play.
XRP stays bearish below its $1.28 CRT low and could test $1.26 and then $1.25 on Sunday if it closes today under that level. A close back above $1.28 would put the 100-day EMA at $1.33 in play.
XRP is down 1.18% after falling below the $1.28 low of its CRT range, with price under all four daily EMAs and RSI at 37.12. ChartNerd says XRP has been compressing in a range for about 10 weeks, so today’s drop sits inside a longer consolidation.
$1.26, the October 18 low, is the nearest support, followed by $1.25 at the bottom of the $1.25 to $1.30 support floor ChartNerd is watching. A close below $1.25 would put the round $1.20 level in play.
US spot XRP ETFs took in $4.25M for the week ending October 23, after a $1.84M outflow the week before ended 13 straight weeks of inflows. Cumulative net inflows stand at $1.80B.